The Solana market price and chart price stood at $82.24 as of 12:35 UTC on November 12, down 1.67% over the preceding 24 hours, according to CoinGlass market data. The token’s $82.03–$85.83 daily range left it near the lower end of the session, with a descending four-hour price structure focusing attention on support. The decline follows another failed recovery below a charted resistance area around $85.50. Although a supplied chart sketches a possible rebound near $76.70, that remains a hypothetical scenario rather than a confirmed turning point.
Solana Price Remains Below Former Support Turned Resistance
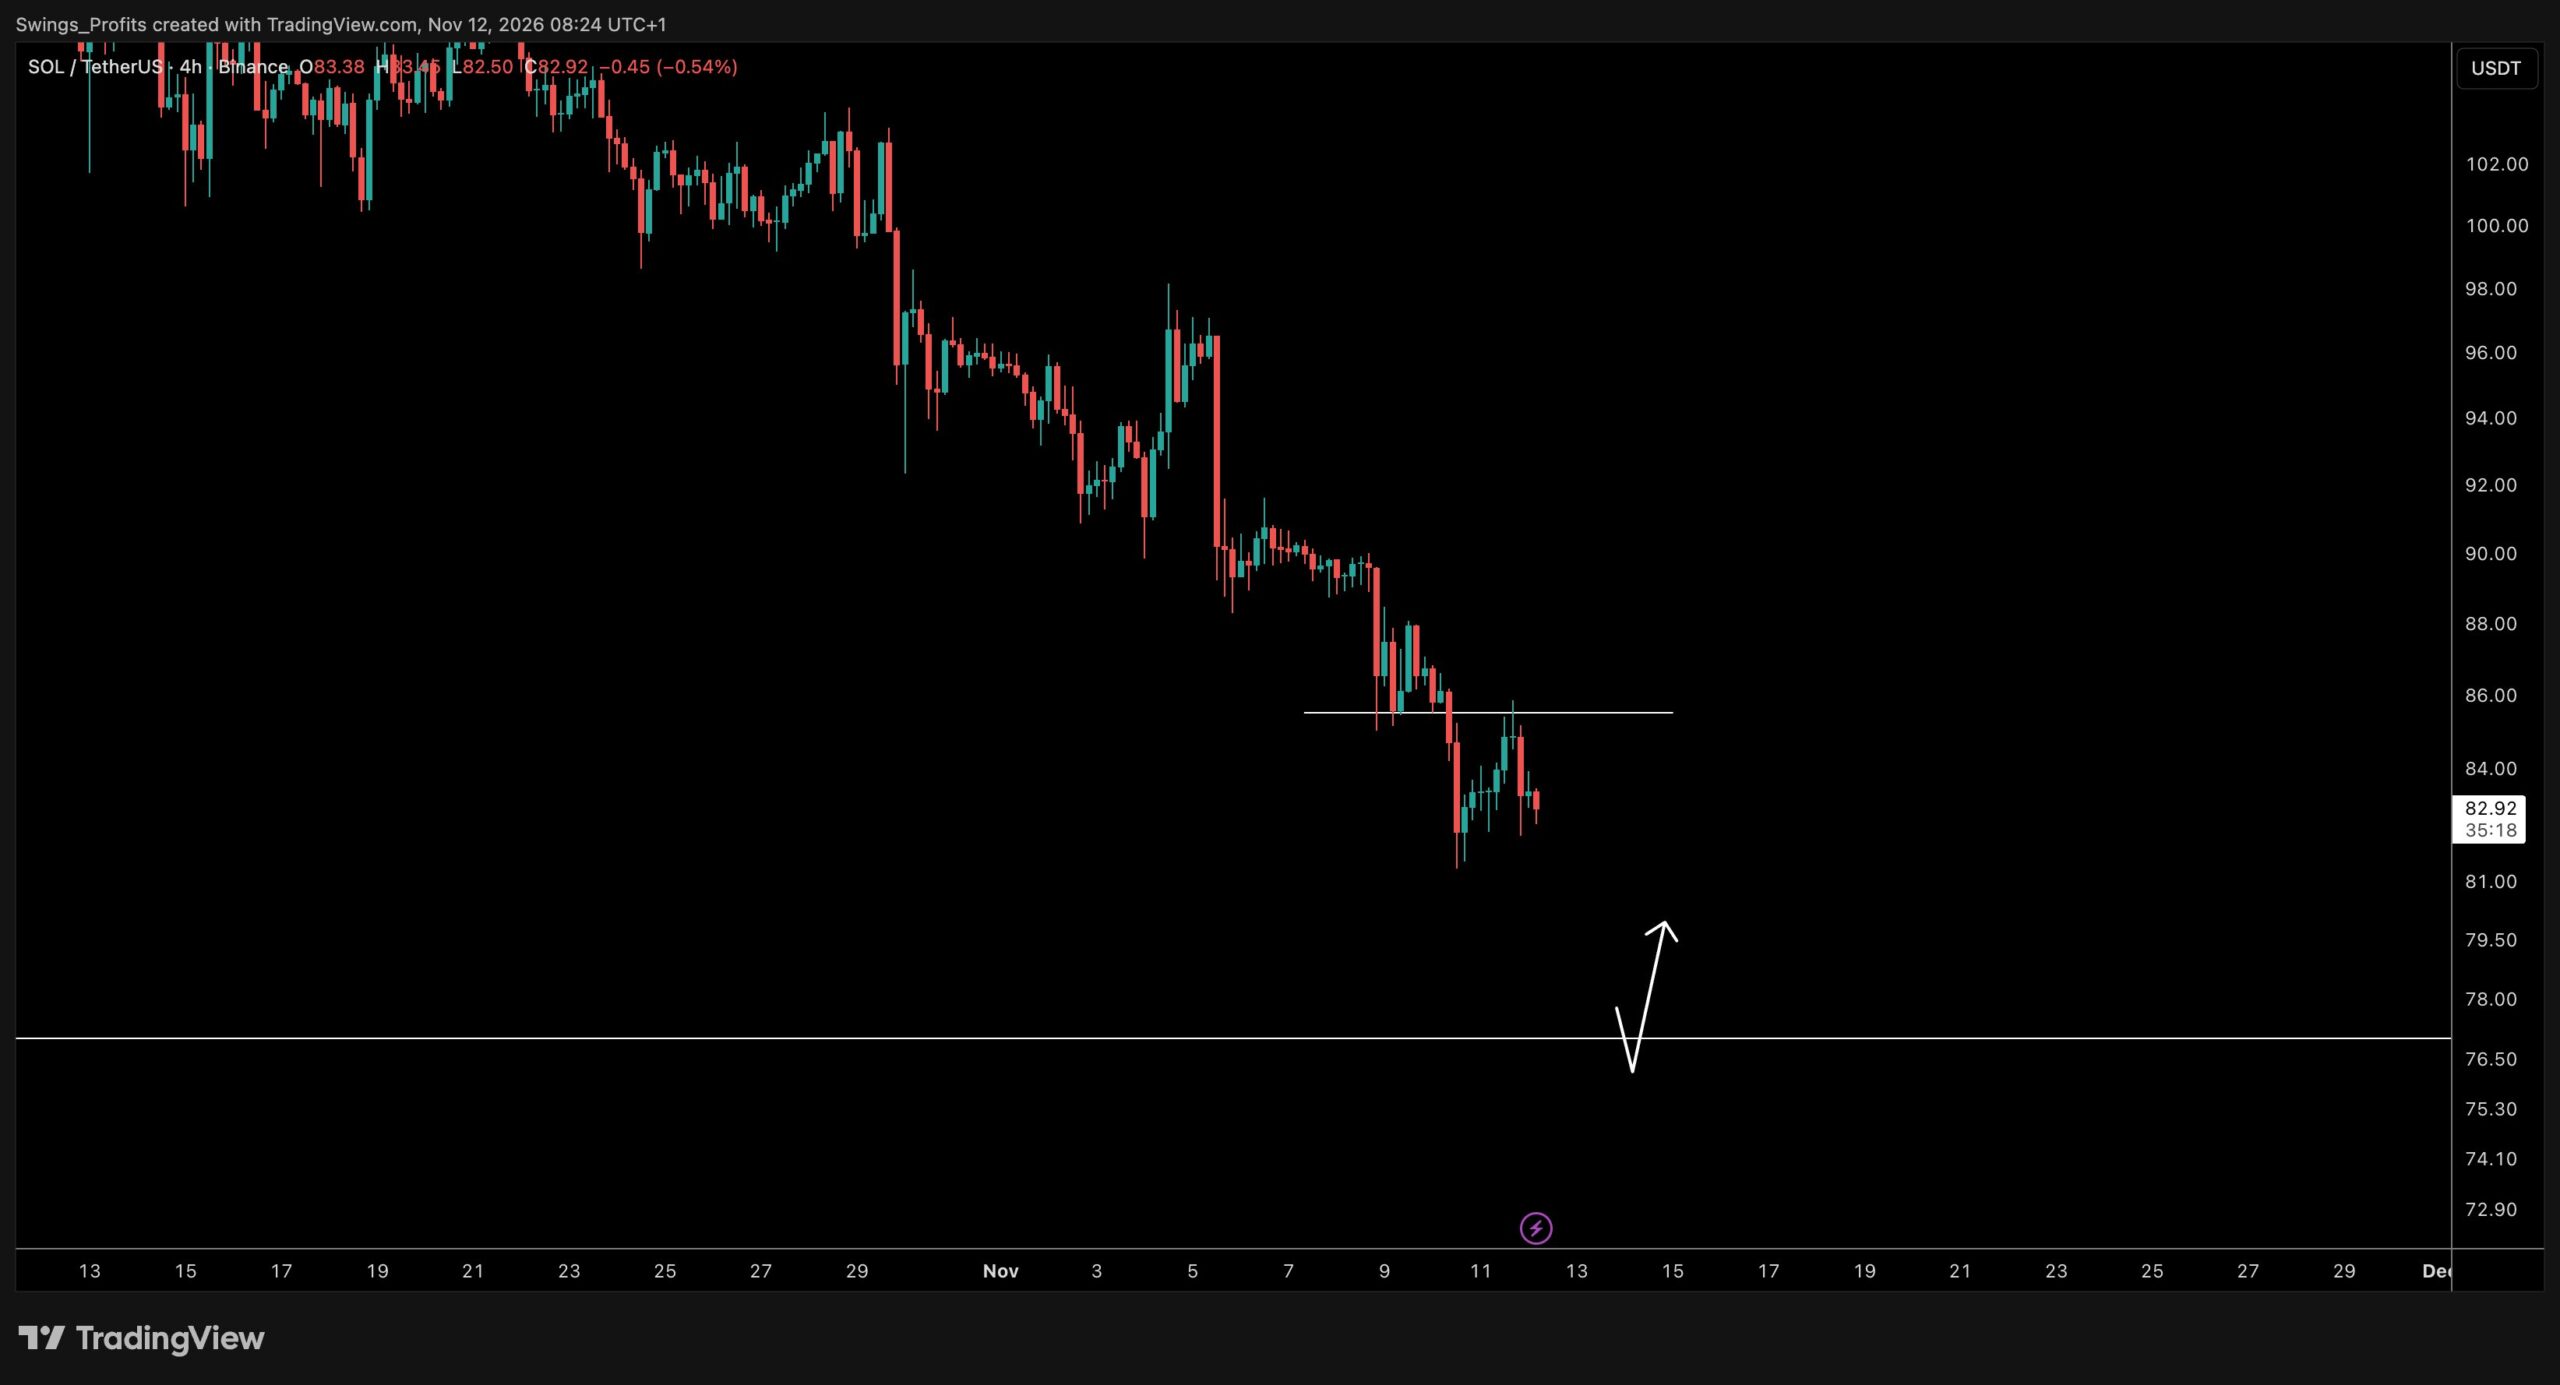
The uploaded TradingView chart shows Binance SOL/USDT market price and chart on the four-hour timeframe. Captured at approximately 07:24 UTC on November 12, its last marked price was $82.92, distinct from the later CoinGlass quotation. The chart traces a retreat from above $100 in late October, with successive recoveries ending at lower levels and further selloffs establishing fresh lows.
A sharp decline around November 5 carried SOL through $90 after a brief advance toward $97. Selling resumed on November 9 and pushed prices beneath $86. That zone subsequently became a ceiling rather than a floor. The horizontal marker around $85.50 aligns with a failed recovery on November 11, after which prices slipped back toward $83.
Recent candles indicate a nearer support band around $81–$82, but the sequence of lower highs remains intact. No RSI, MACD or moving-average readings appear in the supplied screenshot, so those indicators cannot be used to confirm momentum.
The illustration’s lower horizontal reference lies near $76.70. Its arrow sketches a dip through that area followed by a recovery toward $79–$80; neither move has occurred in the screenshot. The image identifies TradingView user Swings_Profits as its creator. A separate post by Crypto Tony was supplied, but its text could not be independently retrieved, so the drawn scenario is not attributed to his commentary.
Solana Derivatives Show Cooling Interest During Recent Decline
CoinGlass open-interest data showed $5.16 billion in outstanding SOL futures positions at 12:35 UTC, a 0.96% decline over 24 hours. Futures volume totaled $4.70 billion, versus $460.17 million in spot turnover. The platform recorded $9.34 million in liquidations, including $6.93 million from long positions, while its open-interest-weighted funding rate was positive at 0.0045%.
Falling prices alongside contracting open interest can indicate traders closing positions or forced exits. The figures do not establish that sellers have exhausted their positions, nor do they identify the next direction.
Markets Watch Whether Support Can Halt Further Losses
A sustained recovery above $85.50 would challenge the latest lower high, while $89–$90 remains a more substantial area to reclaim. Below current prices, failure to defend $81–$82 would bring the chart’s $76.70 reference into focus. The recovery arrow remains speculative unless subsequent price action supports it. For broader market context, BlockBriefing previously examined the recent crypto market decline.