Solana was near $71.05 on the Coinbase SOLUSD TradingView daily chart captured around 12:10 UTC on November 20, 2026, after fresh selling pushed SOL below $72 and beneath the earlier observed trading range. With $71.50 already lost in the later TradingView snapshot, the immediate test is whether buyers can reclaim $71.50 before challenging resistance near $73.50. Until price can rise back above those levels and hold, the short-term structure remains fragile.
The TradingView Solana markets table lists Binance’s SOLUSDT perpetual contract near $72.15, with a session low around $71.55 and a high around $73.54 at the reviewed November 20 observation. The listing’s technical rating was strong sell. These figures describe that named derivatives contract rather than a universal spot-market price.
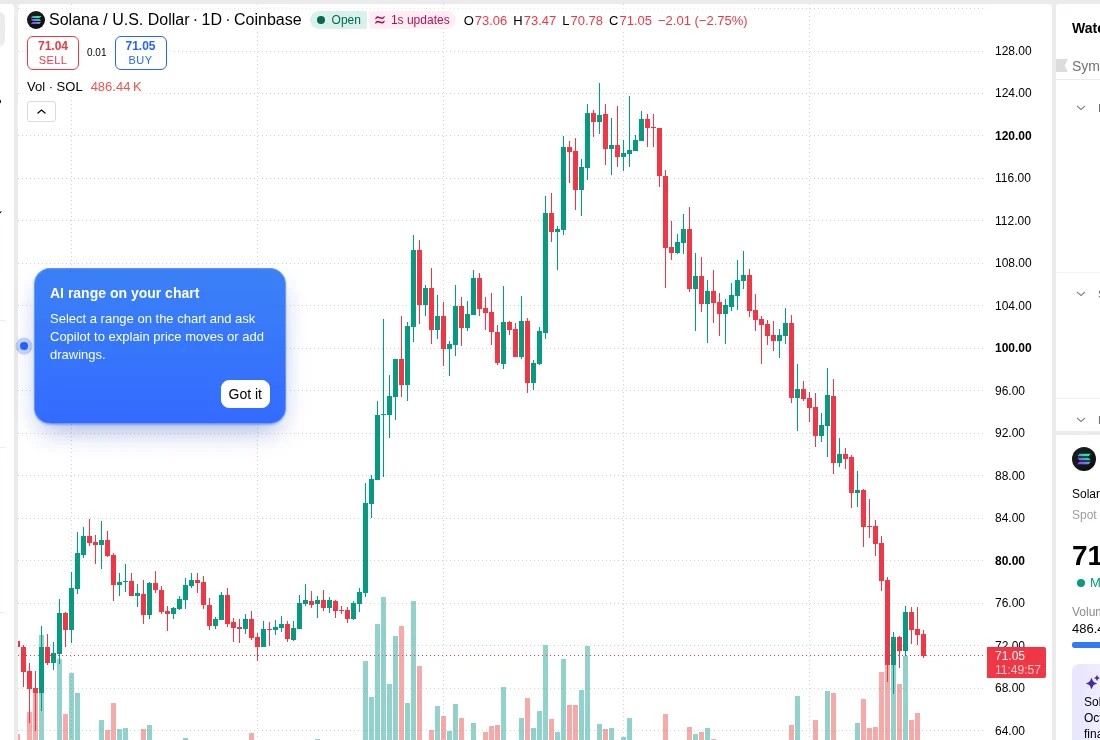
Solana price returns to the lower trading range
Price near $71.05 at the chart capture was already below the earlier observed $71.55 session low, indicating that the day’s decline had extended. That makes this area important for the next few candles. A successful retest may encourage buyers to challenge $73.50. Further weakness beneath the later $71.05 snapshot would show that the market has not yet found durable support.
The larger weekly backdrop is negative, so a bounce should first be read as a test of selling pressure rather than proof that a new uptrend has begun. Strong trends often include countertrend rallies.
Which SOL support levels matter now?
The immediate downside zone lies between $71.50 and $72.00. If the market loses this region, $70 is the next round-number level to monitor. Below that, $68 can serve as another possible scenario marker, but it is not presented as a confirmed demand zone without additional price history.
For the bullish case, SOL must first reclaim $73.50 to $73.60 and remain there during a retest. Above it, $75 and then $76 may attract attention. A recovery above $75 would begin undoing part of the latest decline, though it would not erase the broader monthly loss.
What do Solana trend indicators show?
TradingView’s public market overview reports a steep negative one-month performance figure. The direction of that decline supports a cautious trend assessment. However, the accessible public technical table did not supply numeric RSI, MACD or moving-average values, and no exact readings are claimed.
Traders can instead watch whether the market produces a higher low above $71.50 and a higher high over $73.60. That would provide clearer evidence of stabilization. If each rebound stops sooner than the one before, sellers would still appear to have the upper hand.
Do Solana ETF flows explain the price move?
US spot Solana ETF products reported net outflows of $1.1 million on November 19, attributable to GSOL in Farside’s fund-level table. That is relevant market context, but the amount is small compared with daily trading across the SOL ecosystem. It cannot explain every intraday candle.
BlockBriefing’s separate ETF news report covers the flow data. The technical analysis here focuses on whether current prices hold or break key zones.
Solana outlook for the next session
A move below $71.50 would place $70 under scrutiny. Range trading between $71.50 and $73.60 would suggest traders remain undecided. A sustained push above $73.60, followed by $75, would offer the clearest early sign of improving momentum. These possibilities should be reassessed as fresh candles appear.