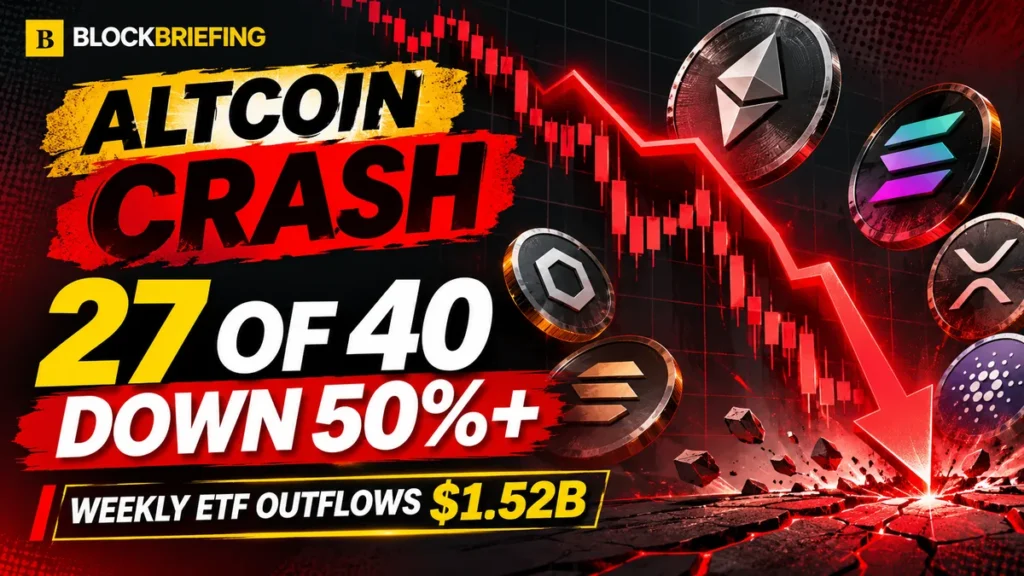
A severe altcoin sell-off has left 27 of 40 cryptocurrencies in a prominent analyst comparison more than 50% below their October 2025 reference peaks. The damage comes as US spot cryptocurrency exchange-traded funds (ETFs) recorded approximately $1.52 billion in combined net withdrawals during the week of November 9 to 13. The figures show deep stress across digital assets, but they do not establish that the market has found a lasting bottom.
The 27-asset figure comes from a November 17 market comparison posted by analyst Crypto Rover. His selected 40-asset sample showed a median decline of 64.9%. It is an analyst snapshot, not an independently audited list of all the largest altcoins. ETF figures refer to the previous trading week, not outflows recorded in the past hour.
Which Altcoins Have Lost More Than Half?
Crypto Rover’s comparison showed Polkadot (DOT) down 83.6%, Cardano (ADA) down 82.9% and Sui (SUI) down 80.5%. Dogecoin (DOGE) lost 78.3% and Avalanche (AVAX) 77.3%, while Solana (SOL) and XRP declined 69.5% and 69.2%, respectively. Ethereum (ETH) was 61.9% below its reference level.
The sample also showed significant differences between assets. Zcash (ZEC) was up 122.5%, Monero (XMR) 45.8% and Quant (QNT) 39.7%. These gains are a reminder that a market-wide downturn does not move every token in the same direction. A 50% decline also requires a subsequent 100% gain just to return to the starting price.
Why Did Crypto ETFs Lose $1.52 Billion?
Farside Investors’ Bitcoin ETF records show approximately $1.065 billion in net withdrawals from US spot Bitcoin funds between November 9 and 13. Its Ethereum ETF flow table recorded about $398.9 million in weekly outflows, while Solana ETF data showed approximately $32 million leaving those funds. SoSoValue’s XRP ETF figures put net withdrawals near $19.13 million.
Combined, those four categories lost roughly $1.52 billion. Bitcoin funds accounted for about 70% of the total. But the trend was not uniformly negative on November 16: Bitcoin ETFs gained $7.9 million and Solana funds attracted $11.7 million, according to Farside, while Ethereum ETFs lost another $8.4 million.
ETF net flows reflect subscriptions and redemptions in specific investment funds. They are not the same as trading volume or the change in the whole crypto market’s value. BlockBriefing has a separate guide to Bitcoin ETF inflows and outflows for readers who want to understand the figures.
What Does Glassnode Reveal About Altcoin Weakness?
Independent data backs up the wider market weakness. In its November 17 Week Onchain report, Glassnode found that only 6% of its 100 largest tracked altcoins traded above their 50-day moving averages. The proportion above the 200-day average fell from more than one-third to 21% in one week.
These moving averages show how current prices compare with recent trends. When so few coins are above them, the downturn is broad rather than confined to a small number of tokens. Glassnode also pointed to weakening stablecoin liquidity, with supply shrinking 4.2% over the previous 90 days. Lower stablecoin supply can reduce the pool of capital available to buy crypto assets.
Is This the Altcoin Market Bottom?
Some market participants believe the selling has gone far enough. Trader Satoshi Flipper argued on X that the altcoin bottom is in, expecting a rebound with support from Bitcoin and Ethereum. That is a market opinion, not a verified price forecast.
Glassnode’s assessment is more cautious. Its research identified Bitcoin demand around $62,000 to $66,000, while warning that a sustained move below $62,000 could expose $58,500 and potentially the realized-price region around $53,700. A recovery toward the short-term holder cost basis near $74,100 would offer more convincing evidence of strengthening conditions.
Historical washouts sometimes develop near local bottoms, but those patterns do not rule out another liquidity-driven decline. Readers can compare the warning signs with BlockBriefing’s explanation of the Crypto Fear and Greed Index.
How Does Extreme Fear Affect Crypto Sentiment?
The Crypto Fear and Greed Index has been in extreme-fear territory, indicating heightened risk aversion. Because the index is heavily influenced by Bitcoin-related conditions, it should not be treated as a direct reading of sentiment for each altcoin.
Widespread losses, weak market breadth and ETF redemptions can reinforce one another. Traders facing losses may reduce positions, while reduced liquidity makes rebounds less durable. Extreme fear by itself is not reliable proof of a market bottom.
What Could Confirm a Sustainable Altcoin Recovery?
The clearest signals to monitor are improving ETF demand, an increase in the share of altcoins trading above their 50-day averages, stabilizing Bitcoin support and renewed stablecoin liquidity. Together, these would suggest buying is spreading through the market rather than remaining limited to a few tokens.
For now, the claim that 27 altcoins dropped more than 50% describes a steep historical drawdown in one analyst’s selected sample. The unresolved question is whether forced selling has been absorbed or whether the market still faces another round of withdrawals and price pressure.