
 Ethereum market price and chart’s November 5 selloff ended near the bottom of a 230.82-
 USDT market price and chart daily range on Binance spot, with substantially heavier volume than its recent norm. The subsequent session was comparatively narrow in the market snapshot observed November 6 at approximately 22:48 UTC, but it did not recover the previous day’s steep losses. BlockBriefing’s own calculations show why the important issue is not simply whether ETH holds 2,200 USDT: buyers must still repair a damaged daily closing-price structure while establishing that the latest recovery can survive completed candles.
The source observations come from the Binance ETH/USDT historical OHLCV records displayed by ChartExchange, with Binance’s public market-data documentation identifying the underlying daily candlestick methodology. We reconstructed 37 daily records from October 1 through November 6, 2026, and calculated the indicators independently. November 5 is the last completed UTC session used for confirmed daily momentum; November 6 is included only as a timestamped partial-day observation. We could not directly download the exchange-hosted historical API response in this session, so exact observations should be treated as a reconstruction from a third-party display of exchange records, not as a separately authenticated Binance export.
November 5 Erased the Previous Session’s Rebound
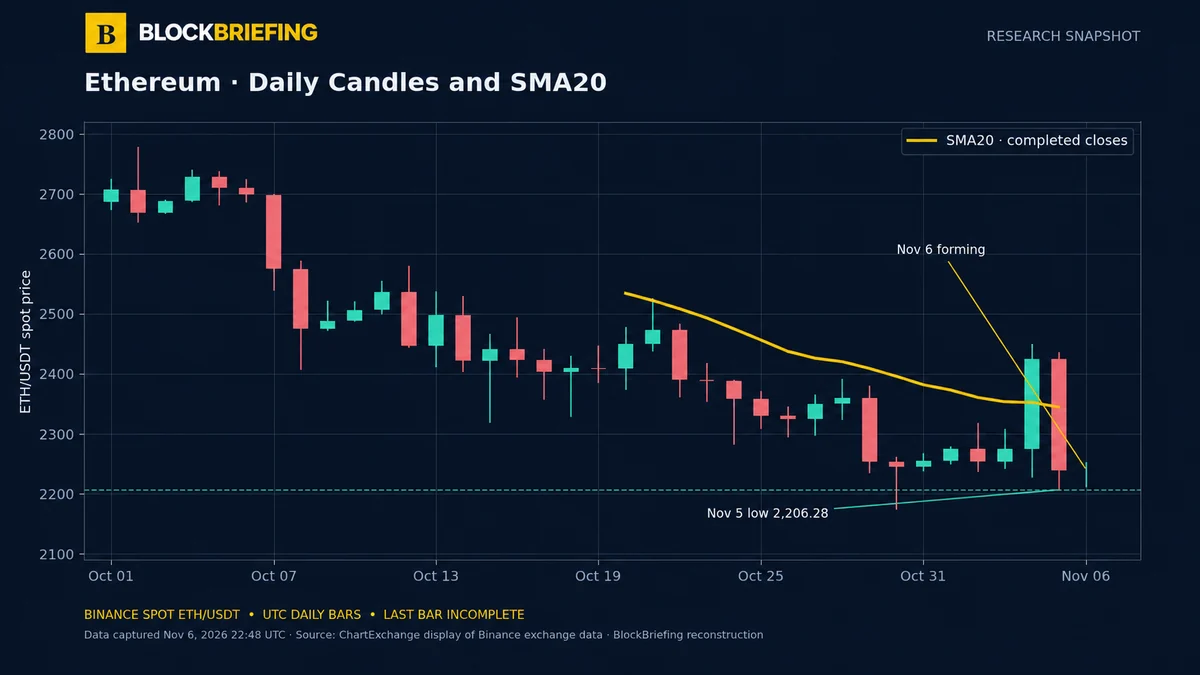
ETH climbed from 2,274.77 USDT on November 4 to a completed close of 2,424.61, a gain of approximately 6.59%. On November 5, the market opened at 2,424.60, reached 2,437.10, dropped to 2,206.28 and finished at 2,238.01. That produced a 7.70% open-to-close fall and erased the preceding session’s closing advance. The November 5 close was also 186.60 USDT below the November 4 close—a sharper move than the preceding day’s 149.84-USDT rise.
The closing location is particularly useful evidence. ETH ended only 31.73 USDT above the November 5 low, despite traversing a 230.82-USDT high-to-low range. Its closing location was therefore 13.75% of the way up from the bottom of that range, calculated as (2,238.01 − 2,206.28) ÷ (2,437.10 − 2,206.28). This is not an indicator predicting the next candle; it establishes that the selloff session ended with very little of its intraday downside recovered.
The 2,206.28 low also sat less than 0.29% above the round 2,200-USDT reference. That proximity makes the area useful for observing subsequent candle behavior, but the round number itself is not proof of exchange-wide support. A temporary wick and a sustained closing breakdown would carry different meanings.
Higher Volume Makes the Failed Recovery More Significant
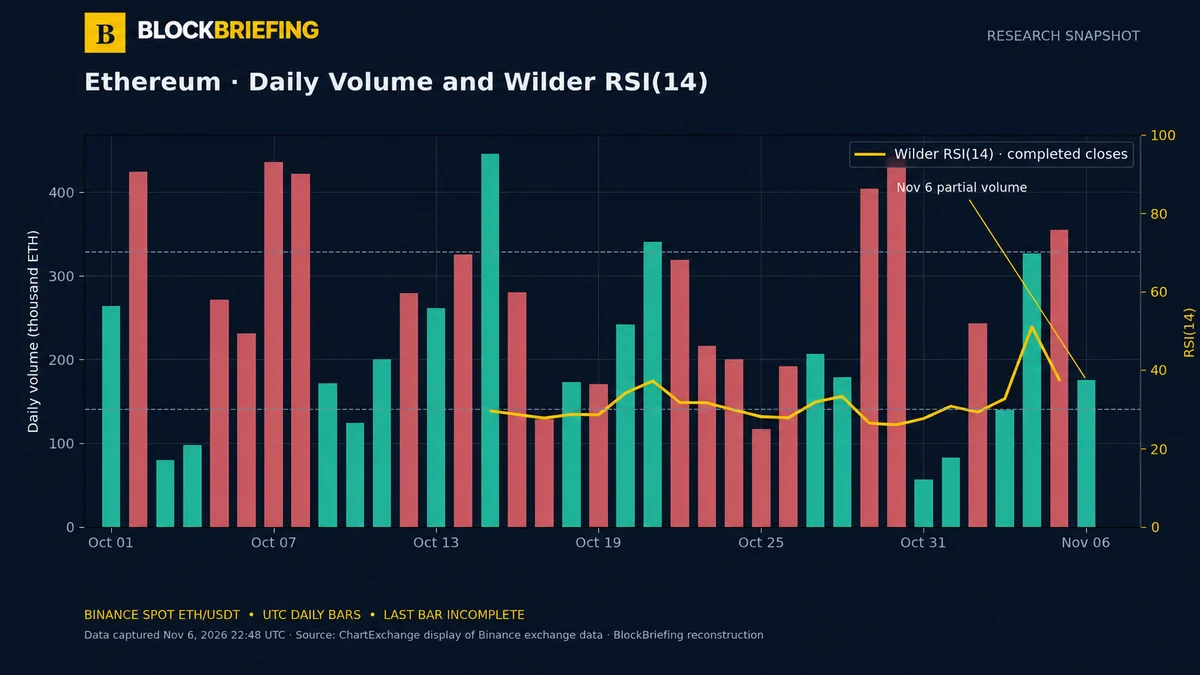
Binance’s displayed daily history reports approximately 354,260 ETH of volume on November 5, versus 325,627 ETH during November 4’s strong up day. BlockBriefing calculated the mean volume of the preceding 20 completed daily sessions, October 16–November 4, as approximately 222,928 ETH. November 5’s total was therefore 1.59 times that baseline, or roughly 58.9% greater.
This creates the report’s central, coin-specific observation: the earlier rally did not fail on unusually quiet trading. Instead, an above-average turnover session coincided with a near-low close. This combination supports describing the completed session as a forceful rejection of the November 4 rebound. It does not identify which market participants sold, establish a liquidation event, or demonstrate that exchange volume caused the decline.
By the November 6 snapshot, reported volume was approximately 174,881 ETH, with the day still open. That figure must not be compared directly against completed twenty-four-hour volume as though the sampling periods were equal. The developing session’s price range, 2,210.00–2,254.26 USDT, was narrower than November 5’s, but a narrow unfinished candle cannot establish a lasting volatility contraction.
The Daily Price Structure Remains Below Its Recent Average
We calculated the completed 20-session simple moving average of daily closes, ending November 5, at 2,343.22 USDT. The November 5 close of 2,238.01 was 105.21 USDT below that average, a 4.49% discount relative to the average. This numerical gap gives readers a measurable way to distinguish a tentative rebound from a return toward the recent closing-price center.
The 20-session SMA should not be mistaken for dynamic resistance that must repel the next rally. An average is a historical statistic; it moves as old observations leave its window. A series of flat closes can mechanically lower the average even without strong buying. What would matter more is whether a recovery above an observed high is accompanied by sustained higher closes rather than a short-lived touch of an average.
RSI Reveals Damage but Not an Automatic Reversal
Our independently calculated Wilder RSI(14) closed November 5 at approximately 37.4, using the available October 1–November 5 closing-price sequence with Wilder’s fourteen-change seed. On November 4, the same reconstruction placed RSI near 51.1. The rapid move beneath 50 shows how quickly the rebound’s improved recent momentum was lost. It is not a guarantee that the decline must continue or that a bounce is due.
Because the source window starts October 1, the 37.4 value reflects that specific RSI initialization period; a longer warm-up can yield a slightly different result. We deliberately exclude the incomplete November 6 close from the confirmed RSI series. Likewise, no MACD or long-term EMA number is presented without adequate verified initialization data.
Key Technical Levels and Their Evidence
Three Conditional Paths for the Next Completed Candles
Recovery: ETH retains the previous session’s 2,206.28 low on completed candles, then moves through the developing November 6 high at 2,254.26. A meaningful recovery would require subsequent completed higher closes and a sustained move toward the recent average, not simply a momentary wick above the high. A completed break back through the prior low would weaken that interpretation.
Continuation: A completed candle closes beneath 2,206.28 and does not promptly reclaim the breached area. That would make the older October 30 low at 2,174.08 the next observed historical comparison. This is a scenario test, not a forecast that price must travel there. A quick return into the previous range would count against a durable breakdown interpretation.
Consolidation: ETH repeatedly closes between the recent 2,206–2,254 extremes while both buyers and sellers fail to sustain follow-through. The appropriate conclusion would be an unresolved post-selloff balance. Future levels should be revised as new completed candles appear rather than preserving a provisional intraday range indefinitely.
Methodology and Limits of the Archived Snapshot
Exchange: Binance spot ETH/USDT. Candle basis: UTC daily OHLCV. Observation: November 6, 2026, approximately 22:48 UTC. Last completed bar: November 5 UTC. The historical table displayed at the observation time provided open, high, low, close and base-asset volume; its 37 rows from October 1 to November 6 were transcribed for this independently calculated analysis. The report’s arithmetic includes the November 5 body and closing location, volume compared with the preceding twenty complete days, twenty-close SMA and Wilder RSI(14). RSI uses fourteen changes to seed initial average gains and losses and successive Wilder smoothing thereafter.
Fixed charts for this research are reconstructed from the same transcribed data and require attachment with accurate captions before publication. The exchange’s public API export was not directly retrieved; thus the data comes from a secondary exchange-history display, and final editorial verification should assess that limitation. No personalized financial advice, certain price prediction or unverified market-causation claim is intended.