
 Bitcoin market price and chart was trading near 75,966
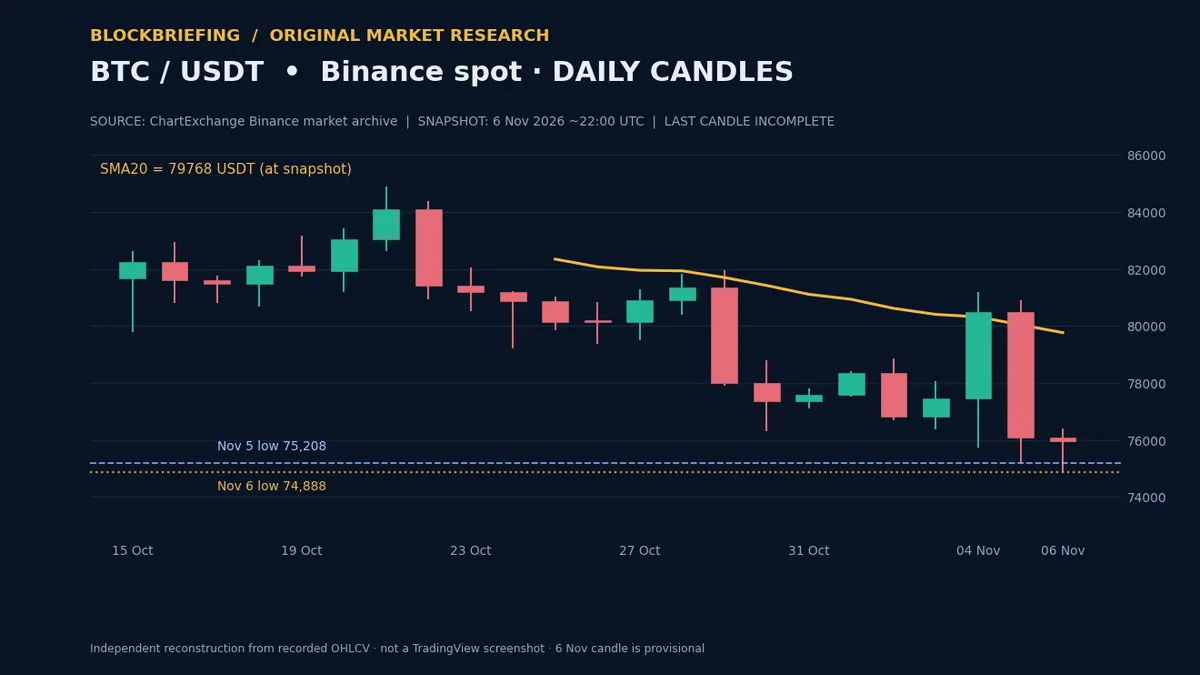
 USDT market price and chart on Binance spot in the November 6, approximately 22:00 UTC market snapshot, after dipping to 74,888 USDT earlier in the developing session. The latest move created a lower daily extreme than the previous session’s 75,208.42 low, but its significance is conditional: a transient move beneath an old low and a confirmed daily close below it are not equivalent. BlockBriefing’s original analysis of the available daily candles finds that the larger problem for buyers is still the distance from the twenty-session price average, not merely the latest 320-USDT low-to-low breach.
The observations are based on the Binance BTC/USDT historical OHLCV table supplied by ChartExchange, retrieved for the November 6 snapshot, and cross-checked against Binance’s Bitcoin reference market page for the surrounding price region. All arithmetic below is BlockBriefing’s own, using the explicitly listed candles; this is an independent reconstruction of historical exchange data, not a TradingView screenshot or a live chart. The November 6 candle was still developing and must not be treated as a completed daily record.
November 5 Volume Suggests the Selloff Was Not a Thin-Market Wick
The November 5 daily candle opened at 80,504.01 USDT, reached 80,918.01, traded down to 75,208.42 and closed at 76,088.00. That was a 5.49% open-to-close decline and a 5,709.59-USDT intraday range. By comparison, November 4 closed at 80,504.01 after rising from 77,453.85. The next day’s decline therefore overwhelmed the previous recovery: the swing from November 4’s close to November 5’s close amounted to 4,416.01 USDT.
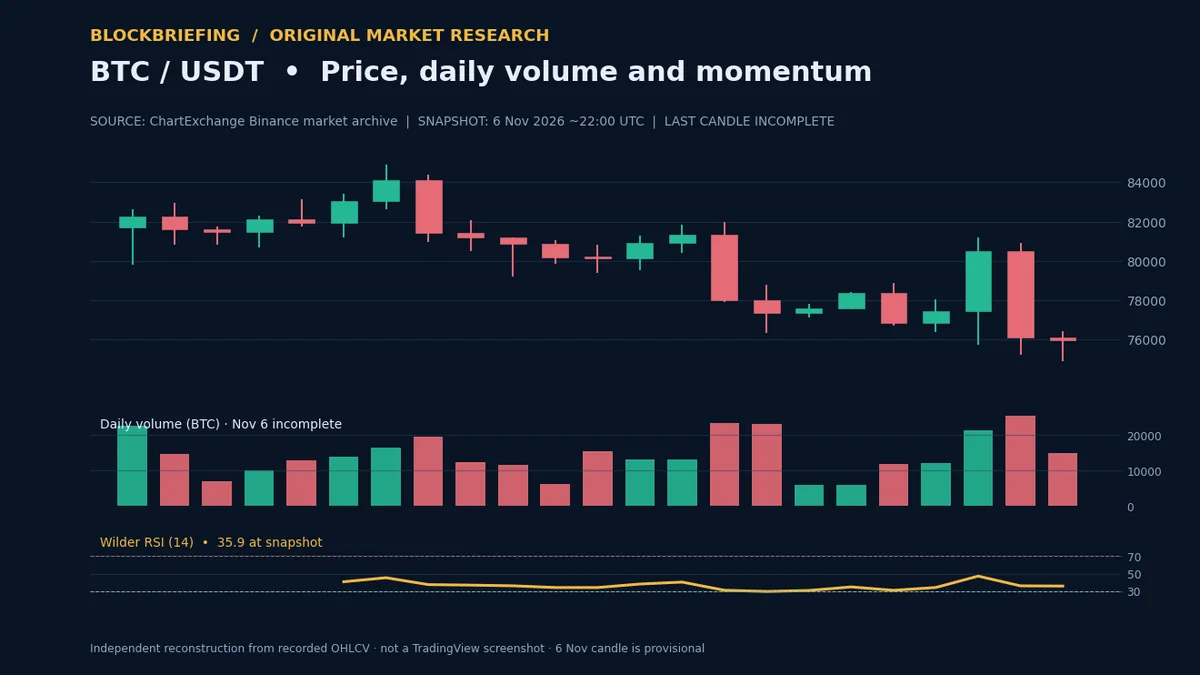
The volume pattern provides a more informative measure of participation. The Binance-history table recorded 25,372 BTC changing hands on November 5. The average for the twenty completed daily sessions immediately preceding November 5 was approximately 13,530 BTC, so the selling day’s reported activity was about 1.88 times that baseline. This does not reveal how much trading was initiated by market sellers, nor whether a specific fund or wallet caused the move. It does show that a large down candle coincided with materially higher reported trading activity relative to its recent history.
The November 6 record showed 14,913 BTC at the snapshot, but comparing that partial-day volume directly with completed twenty-four-hour sessions would distort the result. It belongs in the dataset as a provisional observation, not as a confirmed volume slowdown.
The Daily Chart Defines a Downtrend, Not a Completed Recovery
We calculated a twenty-session simple moving average of 80,043.86 USDT as of the November 5 completed close. Bitcoin’s 76,088 close was 3,955.86 USDT, or approximately 4.94%, below that rolling average. This distance is more useful than a loosely defined description of ‘weak momentum’: it quantifies how far the closing market had moved beneath the recent center of traded closing prices.
Using November 6’s partial close as a point-in-time input yields an updated, provisional SMA20 near 79,768 USDT. The provisional value should not be confused with a completed daily signal. A moving average can fall while price is flat, because older, higher closes drop out of its rolling window. Closing the gap to the SMA is therefore not necessarily proof of strong new buying pressure.
The session’s lower high and lower low relative to November 5 (76,416.24 versus 80,918.01, and 74,888 versus 75,208.42) are consistent with continued short-term pressure. But only the low-to-low comparison is meaningful at that cutoff; November 6’s eventual closing placement remained unknown.
RSI Near 36 Reflects Persistent Losses, Not a Guaranteed Bounce
Our Wilder-smoothed RSI(14), computed from the completed daily closes with the available October 6–November 5 sequence, finished November 5 at approximately 36.1. Incorporating the November 6 developing price as though it were an updated close would produce an indicative 35.9, but that latter figure is provisional and will change before the actual UTC day closes.
The measure sits below the neutral midpoint of 50, consistent with more recent average downside than upside price change. It is not below the conventional 30 oversold reference in this dataset. More importantly, RSI is a transformation of price history, not independent evidence that a rally must occur. In a declining market, RSI can remain weak while prices make further lows.
Volume and momentum together suggest a specific question for the next session: can Bitcoin stabilize above the prior low on completed candles while reducing the negative gap to the price average? Without that confirmation, labeling the market ‘oversold and ready to rebound’ would substitute optimism for analysis.
Price Levels Follow Observable Candle Extremes
These are levels observed or computed from Binance BTC/USDT data, not price targets and not necessarily identical to US-dollar exchange pairs. The low may have been briefly swept before a return into the prior range; additional confirmed candles are needed to distinguish rejection from continuation.
Three Scenarios, Each With a Test That Could Disprove It
Recovery: A sequence of higher completed four-hour closes that first retains the 75,208 prior-session low and then clears 76,416 would be the initial sign of improving short-term structure. That alone would not erase the daily downtrend beneath the 20-session average. A close back below 75,208 after such a breakout would weaken the improvement thesis.
Continuation: A completed daily close beneath 74,888, ideally accompanied by another session of above-normal volume, would offer stronger evidence that the downward structure remains in place. A new intraday low followed by a daily close back inside the prior range would not meet the same condition, and should be reported differently.
Consolidation: If completed closes cluster between the 74,888 low and the 76,416 snapshot high, the most responsible description would be a market digesting a prior high-volume decline. The eventual breakout direction cannot be determined from these candles alone. New session boundaries would have to be established before drawing a durable trading range.
Methodology and Publication Cutoff
This report uses the publicly displayed Binance BTC/USDT spot daily OHLCV history relayed by ChartExchange, with 31 completed or developing daily records from October 6 through November 6, 2026. The latest observed market page was stamped about 22:00 UTC on November 6. The November 6 row is expressly treated as incomplete. BlockBriefing calculated daily range, prior-low breach, completed 20-session simple close average, volume-to-prior-20-day average and Wilder RSI(14). Wilder RSI was initialized from the first fourteen price changes within the available date window and therefore depends on the selected historical warm-up length.
The two charts accompanying this research are original, non-updating BlockBriefing reconstructions from the recorded data, not screenshots from TradingView. They must carry the exact observation time, original data source, pair, candle interval and provisional-bar warning. The accessible historical table is a secondary display of Binance-market candles; a direct exchange-hosted OHLCV export was not independently recovered for this edition. Readers should regard this limitation when comparing exact levels or exchange volume with other venues. No MACD or EMA value is presented because its full, consistently warmed-up historical series was not independently verified. This publication provides conditional research, not personalized investment advice or guaranteed price forecasts.