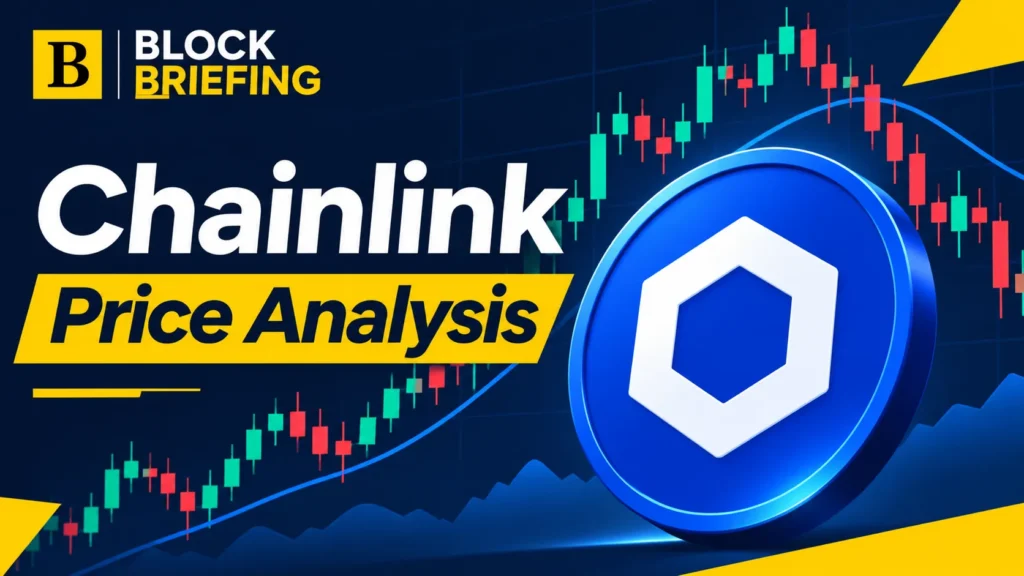
Chainlink market price and chart (LINK) is attempting to hold the $10 area after a difficult stretch for the token, but softer trading activity and negative capital-flow readings complicate the recovery. CoinGlass showed LINK near $10.45 during the November 12 check, with a 24-hour range of approximately $10.22 to $10.59. The market’s next test is whether buyers can turn that rebound into a sustained move above nearby resistance.
Chainlink Price Chart Shows Resistance Above Current Trading
The TradingView LINK/USD chart places the current battle against a broader corrective backdrop. On CoinGlass’s contemporaneous range, $10.59 is the first resistance to watch, followed by the $10.87–$11 region. A daily close above those barriers would strengthen the case for stabilization; repeated rejection would leave LINK exposed to another test of $10.22 and the psychological $10 mark.
Analyst Hov Highlights Conditional Elliott Wave Market Scenarios
Market analyst Hov (@HovWaves) has shared a LINK chart on X, adding an analyst perspective to the debate over whether the correction is nearing exhaustion. Hov has previously discussed LINK in Elliott Wave terms, including the possibility of another advance following a corrective phase. The detailed annotations in this latest linked post could not be independently verified, so no fresh wave target is being attributed to it here.
From a technical standpoint, any bullish wave count still needs price confirmation. A rebound that fails below resistance can remain part of a downtrend, while a breakout with improving spot participation would provide a stronger signal. Traders should distinguish a chart projection from a confirmed change in market structure.
CoinGlass Spot Outflows Contrast With Rising Open Interest
CoinGlass LINK market data showed approximately $55.05 million in 24-hour spot volume, down 30.53%, and $310.50 million in futures volume, down 28.47%. Meanwhile, open interest rose 0.79% to $477.13 million. The platform recorded roughly $530,000 in net spot outflows and $16.1 million in net futures outflows over 24 hours.
That divergence warrants caution: slightly higher outstanding derivatives positions do not establish fresh buying, especially when turnover is falling and both reported flow measures are negative. CoinGlass also displayed a positive funding rate of about 0.0066%, indicating that perpetual-futures positioning carried a modest long-side premium at the measurement time.
Key LINK Levels Determine Near Term Price Direction
For LINK, $10.59 is the immediate upside trigger, while $10.22 and $10 remain the closest downside reference points. A break below $10 could increase pressure toward the next lower support region; conversely, sustained trade above $10.87–$11 would challenge the bearish near-term structure. Those levels are analytical thresholds, not price guarantees.
Institutional developments provide context but not proof of buying pressure. Chainlink recently reported a Moody’s Ratings CCIP pilot, while BlockBriefing previously covered Charles Schwab adding LINK to its crypto offering. The next price move will depend on whether market demand follows those developments.