
Ethereum bounced back toward $1,785 on November 17 after falling close to $1,749, but the recovery still leaves buyers with work to do. ETH remains below $1,800 and its hourly trend line. Until it can rebuild above $1,815–$1,825, rallies remain vulnerable to renewed selling.
The Coinbase one-hour chart on TradingView shows a market struggling to recover from its recent decline. The latest bounce lifted Ether from the session low without restoring the trading area it held before the selloff.
Ethereum price analysis faces resistance near the $1,820 area
The hour ending at 16:00 UTC dropped from around $1,813.50 to $1,783.87 and reached $1,749.32 along the way. Volume was about 4.3 times the average of the preceding 20 hours. The sharp fall and heavy turnover make that hour an important reference for the next recovery attempt.
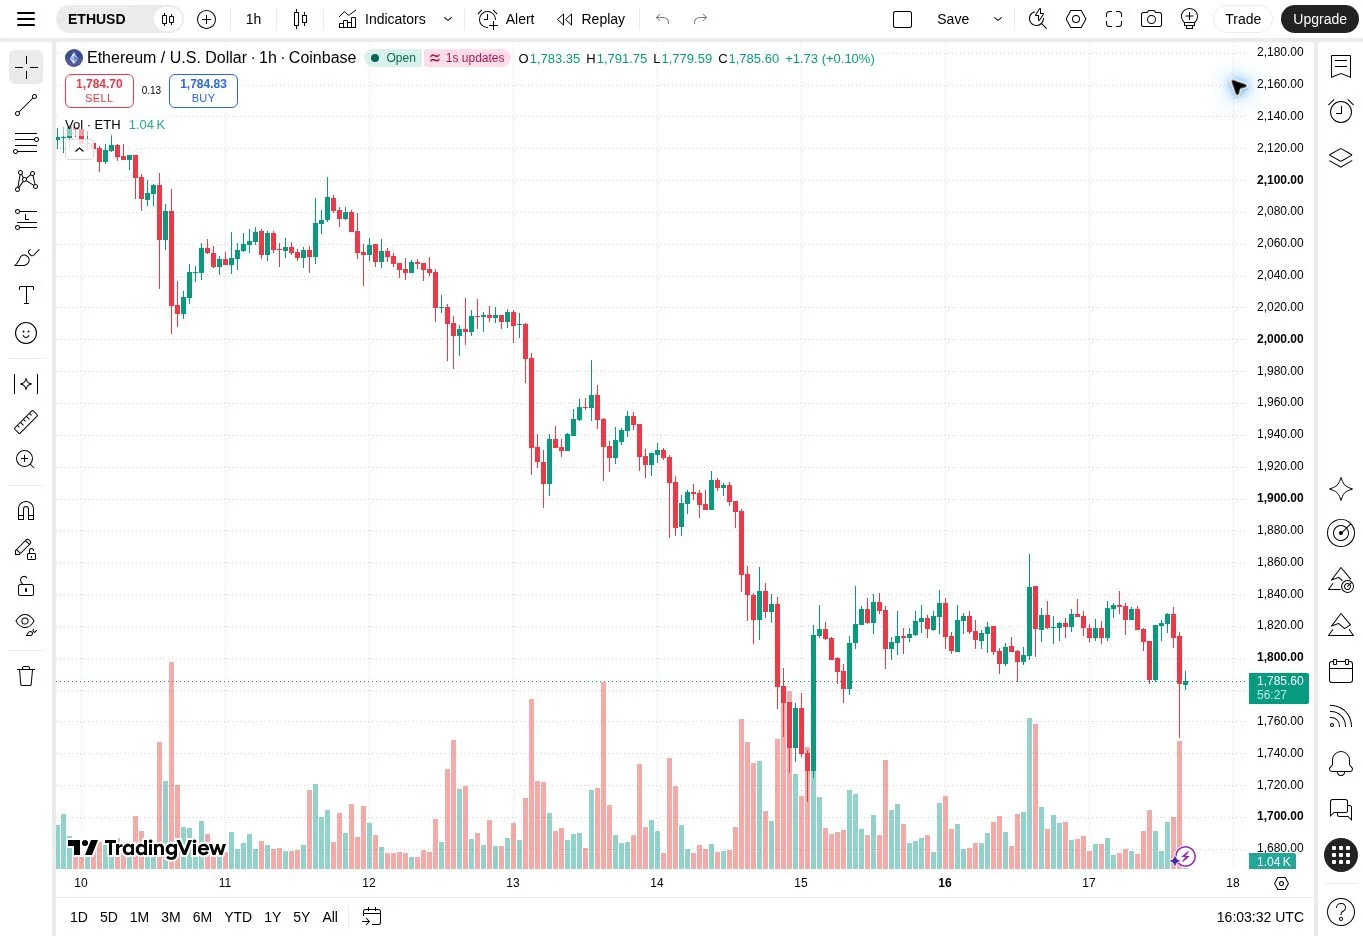
Ether’s 20-hour exponential moving average stands near $1,815. The daily pivot is around $1,823. Rather than treating each number as a separate barrier, the useful resistance area is $1,815–$1,825.
A move above that band would put $1,842 back in view, followed by approximately $1,861–$1,865. Clearing those higher levels would suggest buyers are regaining control of the recent range. Rejection below $1,825 would leave the rebound looking fragile.
Daily momentum remains weak despite the oversold reading
The daily relative strength index, or RSI, is 25.6. Below 30 is usually described as oversold, but the practical message is that selling has been persistent. It does not remove the need for price to establish a stronger base.
The daily 20-period moving average sits near $2,095.50, while the 50-day average is about $2,360.60. Those levels underline the damage to the broader trend. Recovering $1,800 would help stabilise the near-term picture, but would leave much of that decline unresolved.
On the downside, $1,780–$1,785 is the first area to monitor. It combines the first calculated daily pivot support with the previous session’s low. Ether has bounced back into that area, so the next test is whether buyers can keep it.
Holding $1,780 would give buyers room to rebuild
If ETH settles below $1,780 again, attention shifts toward $1,749 and the next calculated support near $1,743. A sustained break would bring the recent low around $1,709 into focus.
The stronger recovery case needs two things: support holding around $1,780 and an hourly close above $1,825. A successful retest of the higher band would matter more than a quick move through it, because it would show buyers defending ground they had just recovered.
BlockBriefing’s earlier market selloff coverage provides background to the wider weakness. Ether’s immediate direction now depends on its response around these much closer support and resistance zones.
The near-term bias stays defensive below $1,825. Holding $1,780 would buy time for a base to form; losing it again would leave the recent lows exposed.