
XRP recovered toward $0.96 on November 17 after sellers knocked it back from the upper end of its recent range. Buyers have prevented an immediate collapse, but they have yet to clear the resistance around $0.973–$0.979. That leaves the rebound caught between nearby support and a familiar selling area.
The Coinbase one-hour chart on TradingView shows XRP stabilising after a much larger decline. The latest recovery is still taking place within that damaged trend, rather than above a clearly established breakout.
XRP price analysis puts the $0.96 area first
The hour ending at 16:00 UTC traded as high as $0.9741 before falling to $0.9449 and closing at $0.9599. Volume reached about 3.3 times the average of the preceding 20 hours. The recovery from the low shows demand, but the long trading range also shows how unsettled conditions remain.
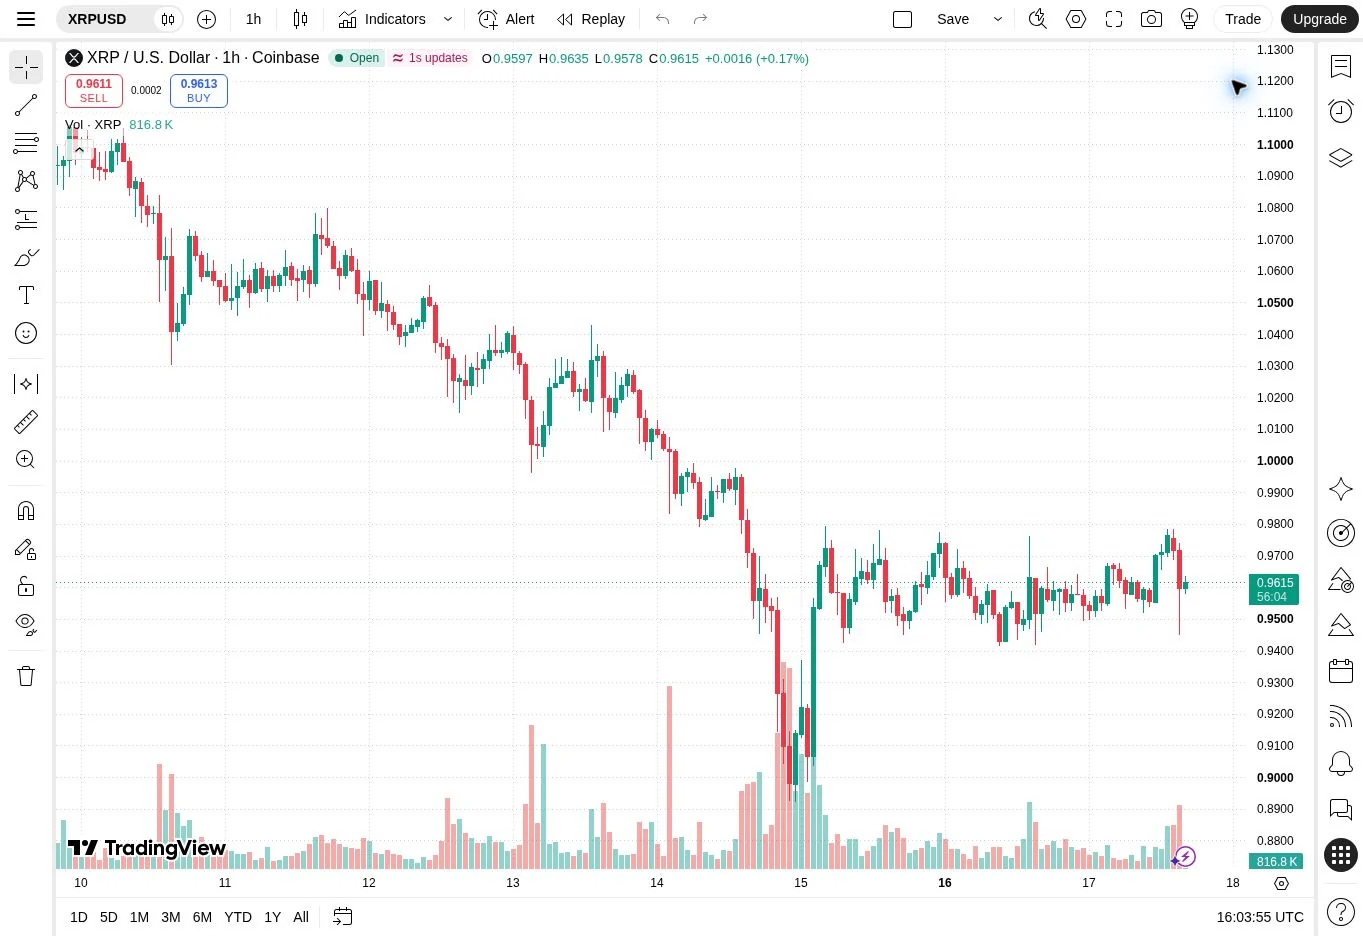
The 20-hour exponential moving average is near $0.9627. XRP is trading close enough to that line for repeated crossings to be less useful than a clear move away from it. Buyers need to hold above it, then push beyond the recent highs.
The first meaningful resistance band is $0.9733–$0.9785, combining calculated daily pivot resistance with the session high. A firm hourly close above the band would be a more useful sign of strength than another brief touch.
Oversold daily momentum still needs confirmation from price
Daily relative strength index, or RSI, stands at 26.0. The reading is oversold, but that mainly tells us how strongly the preceding decline has weighed on momentum. A stronger price structure is still needed before calling a broader turn.
The daily 20-period moving average is near $1.1149, while the 50-day average is around $1.2894. Both remain well above XRP. Even a return to $1 would leave the token below these longer trend measures.
The first support area is $0.9545–$0.9574, covering the previous daily close and central daily pivot. Holding above it would help XRP build a floor beneath $0.96. Repeated closes below it would weaken that attempt.
A break above $0.9785 would strengthen the recovery
Below the band, the latest low near $0.9449 and previous daily low at $0.9414 are the next checks. A sustained break would expose calculated support near $0.9385, followed by $0.9226. The recent seven-day low around $0.8922 sits further below.
If buyers clear $0.9785 and hold it on a pullback, the next calculated resistance is near $0.9922, ahead of the round $1 level. These are conditional tests, not a reason to assume the entire distance will be covered.
The shift from the levels discussed in BlockBriefing’s November 10 XRP analysis reflects how much ground the market has lost. Today’s recovery must be judged against the current range.
XRP has room to improve if $0.9545 holds. Until the upper range breaks, however, the evidence supports a stabilisation attempt rather than a confirmed reversal.