
Solana recovered toward $72.50 on November 17 after a sharp pullback briefly took it below $71. Buyers have recovered some ground, but SOL is still struggling to hold its hourly trend line. The next test is whether it can reclaim $72.60 and turn the nearby $73 area into support.
The Coinbase one-hour chart on TradingView shows an improving short-term base beneath a wider downtrend. The recent push above $73 failed to hold, making the response to that same area particularly important.
Solana price analysis turns to the $72.60 barrier
The hour ending at 16:00 UTC opened near $73.73, touched $73.98 and then fell to $70.93 before closing at $72.38. Volume was about 2.1 times the average of the preceding 20 hours. The bounce from the low shows buyers stepping in, but sellers still forced a sizeable retreat from the highs.
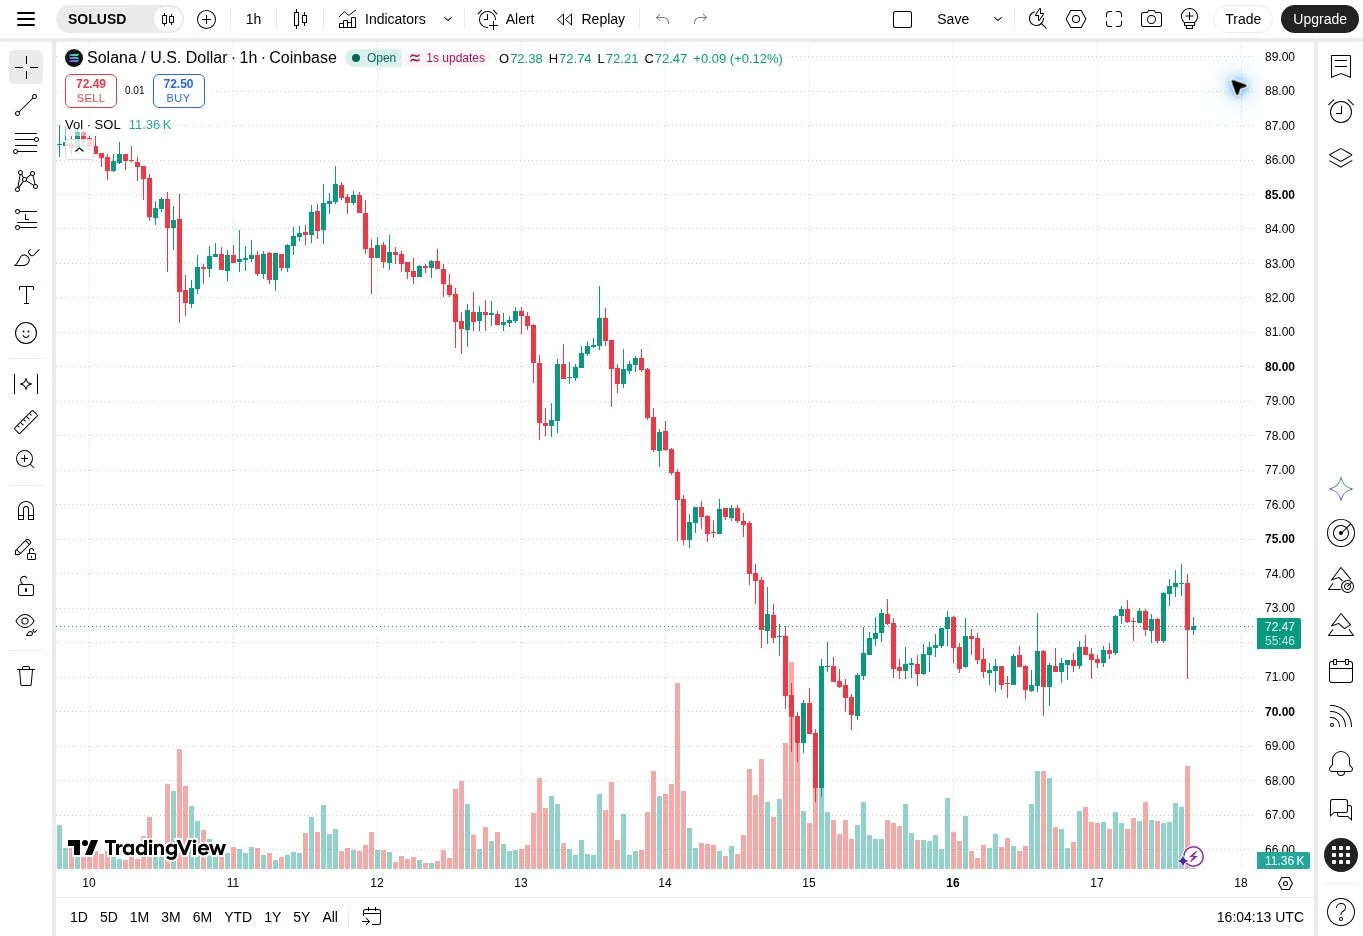
SOL’s 20-hour exponential moving average is around $72.57. Price is close to that line, so a brief crossing would carry little weight by itself. A close above it followed by a successful retest would give the recovery a stronger footing.
The next resistance band is $72.86–$72.96, combining the previous daily high with first calculated daily pivot resistance. Beyond it, the session high at $74.27 and second pivot resistance around $74.40 form the next hurdle.
The daily downtrend remains intact despite oversold momentum
The daily relative strength index, or RSI, is 20.5. That is deeply oversold, showing how one-sided the recent decline has been. Such conditions can produce sharp rebounds, but they can also persist while price keeps making lower highs.
The daily 20-period moving average remains near $85.67, and the 50-day average is around $100.83. Those distant levels underline the difference between repairing an intraday selloff and reversing the broader trend. Buyers need a sequence of higher lows before the daily picture materially improves.
The central daily pivot near $71.41 and previous daily close at $71.51 provide an initial support area. Holding above it would keep the latest rebound intact and give SOL another chance to test resistance.
Support near $71 decides whether the rebound holds
Below that band, $70.93 is the immediate low to watch. A break would put the $69.97 calculated support and $69.87 previous daily low in focus. If that zone also gives way, the next references are $68.42 and the recent seven-day low near $67.37.
The bullish case strengthens if SOL holds above $71.50, recovers $73 and then finds buyers on a pullback. Another rejection at $72.60–$73 would instead suggest the market is still struggling to absorb supply.
The lower levels compared with BlockBriefing’s November 12 Solana analysis show that the wider damage remains substantial. Today’s bounce is a first step, not evidence that all of it has been repaired.
For now, the useful dividing lines are $71 below and $73 above. How SOL behaves around them matters more than the oversold reading alone.