Bitcoin price update, November 20, 2026, 17:00 UTC: Bitcoin fell below the $60,000 level after BlockBriefing’s earlier chart snapshot, marking a new stage in the selloff. Bitstamp BTC/USD traded as low as $58,701.19 during the 16:00 UTC hourly candle, after the previous hour reached $59,316.72. The break turns $60,000 into an important level to watch on any rebound, while the latest hourly low is a nearby downside reference rather than guaranteed support.
The official Bitstamp hourly BTC/USD market data show a 16:00 UTC candle opening at $59,393.31, with a high of $59,760.25, a low of $58,701.19 and a close of $59,441.04. This update uses Bitstamp’s actual hourly trading records and preserves the publication time of the earlier TradingView screenshot. The newer figures are not presented as if they appeared on the older screenshot.
What Does Bitcoin Falling Below $60,000 Change?
A move through a widely watched round-number level can alter short-term trading behavior, but it does not by itself prove how far the market will fall next. On the cited Bitstamp candles, $60,000 becomes the immediate level to recover, and the observed $58,701.19 session low is a downside price reference. Traders should also monitor volume, wider market conditions and whether a rebound holds rather than treating any single level as certain.
Earlier TradingView snapshot: Bitcoin was near $61,410 on the Bitstamp BTCUSD daily TradingView chart captured around 12:10 UTC on November 20. At that time, the market was testing the $61,000 area, with $62,600 and $64,000 identified as recovery levels. Those observations remain historical context and have been overtaken by the subsequent decline.
The TradingView BTCUSD markets table provides the price and session-range reference used here. Its Binance BTCUSDT perpetual-market listing showed about $61,783, with a session low around $61,256 and high around $62,615 when checked on November 20. These are exchange-specific perpetual-contract observations, not a Bitcoin spot-market closing price. Higher and lower scenario zones are analyst reference levels rather than TradingView forecasts.
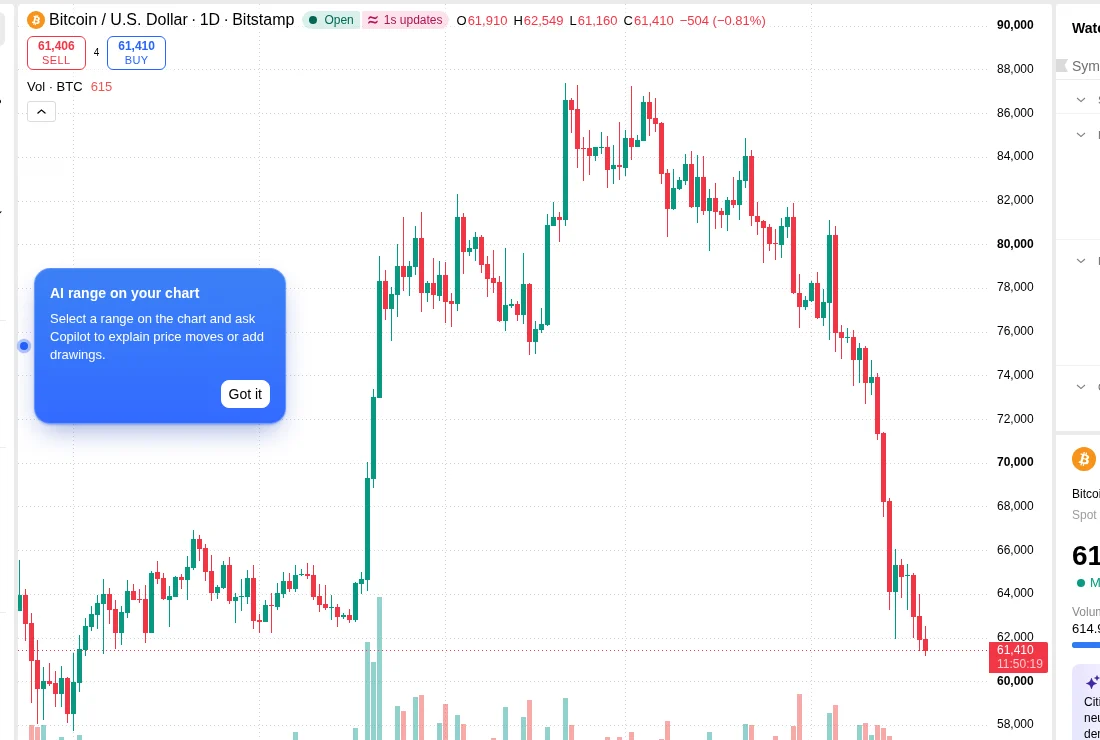
Bitcoin price slips toward an important support zone
Bitcoin had traded between roughly $61,256 and $62,640 during the ongoing November 20 UTC session in the reviewed market data. These boundaries matter more than a single last-traded quote, which can change before an article appears online. A move through $61,250 would place the round $61,000 level under immediate pressure.
A brief break below support would not by itself prove a sustained selloff. Traders normally look for follow-through, such as repeated candles closing beneath the zone or a failed attempt to regain it. If BTC quickly recovers $61,250, the move could instead turn into a false breakdown.
Which Bitcoin resistance levels matter today?
The first resistance zone runs from $62,500 to $62,650, close to the session’s upper trading boundary. Clearing that area would weaken immediate selling pressure but would not erase the wider weekly fall. A more convincing recovery would require a move back over $64,000 and the ability to hold that price during a retest.
Until that happens, buyers may be responding to oversold conditions rather than starting a lasting uptrend. TradingView’s technical overview describes the daily Bitcoin signal as sell and the weekly signal as strong sell. Those are aggregated indicator ratings, not guaranteed predictions. The public indicator table did not provide a numerical RSI or MACD reading during this review, so no such figure is asserted here.
Could Bitcoin fall below $61,000?
The downside case begins with a decisive failure at $61,250 followed by a move under $61,000. That could shift attention to $60,000 as a psychological level. The $60,000 figure is a proposed reaction zone, not a verified resting order concentration or an automatically triggered price target.
The neutral case is a range between roughly $61,250 and $62,650 while traders wait for a clearer direction. In the bullish case, BTC recovers $62,650, then pushes toward $64,000. A daily close above the latter level would strengthen the argument that near-term selling is losing control.
What do ETF outflows add to the picture?
US spot Bitcoin ETFs recorded $582.3 million in net outflows on November 19, according to Farside Investors, led by BlackRock IBIT. That flows backdrop may weigh on confidence, but it should not be confused with an exact BTC sale amount or a direct explanation for every price movement. BlockBriefing covered the fund-level outflow figures separately.
Bitcoin outlook for the next session
The practical question is whether Bitcoin can reclaim the previous session’s broken prices or continues to build lower highs. For now, $61,250 and $61,000 define the immediate downside risk, while $62,650 and $64,000 define the recovery test. These are working chart zones that may change as new candles form, not fixed predictions.