
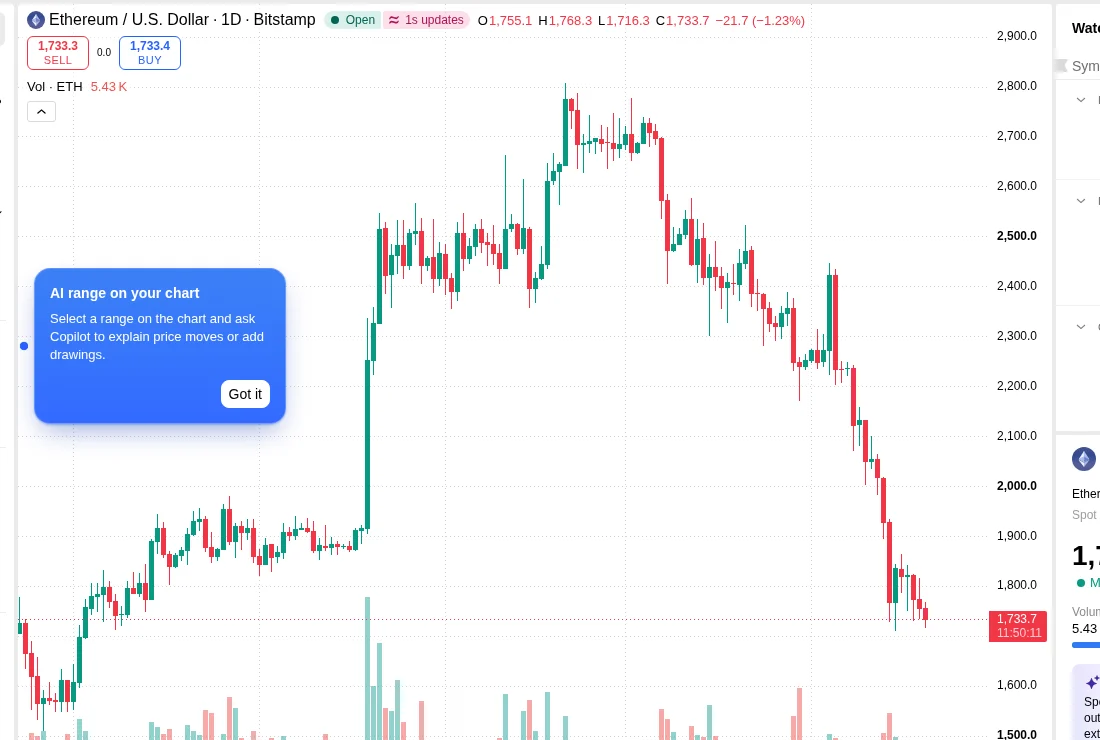
Ethereum traded near $1,734 on the Bitstamp ETHUSD TradingView chart captured around 12:10 UTC on November 20, 2026, with sellers still controlling the larger weekly trend. The immediate market test is whether ETH can remain above its session low near $1,717. A break below that area would put $1,700 in focus, while recovery through $1,770 and $1,800 would ease pressure.
The TradingView Ethereum markets table is the market-data source for this edition. Its Binance ETHUSDT perpetual listing showed approximately $1,752, with a session low near $1,717 and high near $1,770 when reviewed on November 20. These values belong to that perpetual contract, not an exchange-independent spot candle. The levels above and below the range are conditional chart scenarios.
Ethereum finds support after a difficult week
The reviewed November 20 data placed ETH’s session high near $1,770 and its low near $1,717. The later Bitstamp chart screenshot near $1,734 shows price below the session high but still above the earlier $1,717 lower boundary. Neither a lasting breakout nor a fresh breakdown was established at the captured level. Buyers were attempting to hold the lower portion of the range after the wider selloff.
A bounce from a low does not confirm that demand has reversed the trend. A stronger sign would be a higher short-term low, followed by a move above the previous high. Without that sequence, rallies may attract sellers who were unable to exit during the decline.
Which ETH levels could decide the next move?
Initial support sits in the $1,715 to $1,720 area, followed by the round $1,700 level. These are chart reference zones, not exact floors that must stop a decline. If $1,700 breaks and stays broken, the next widely watched psychological region is $1,650.
On the upside, ETH first needs to clear $1,770, near the reported session high. $1,800 is the next round-number test. A return above $1,800 could open a path toward $1,860, but that higher level is a scenario marker rather than a forecast guaranteed by a specific indicator.
What does momentum suggest for Ethereum?
TradingView’s public summary shows a negative performance picture over the past seven and thirty days. That supports describing the wider structure as weak. It does not justify claiming a precise RSI, MACD crossover or moving-average value: the numerical indicator fields were unavailable in the accessible public technical table.
The clearest observable signal is still price structure. A sequence of lower highs suggests sellers remain active on rallies. A higher low followed by a break above $1,800 would begin changing that reading. Volume and successive candle closes would help assess whether a move is gaining acceptance.
Do Ethereum ETF outflows affect the analysis?
US spot Ethereum ETFs registered $131.2 million in net outflows on November 19, led by BlackRock’s ETHA. Fund flows show changes in creations and redemptions, not the reasons for an individual ETH market trade. BlockBriefing reported the ETF breakdown in a separate news story.
The outflows are relevant market background, but they cannot prove that institutional demand will continue to fall or that ETH must revisit a particular price. Price confirmation remains essential.
Ethereum price outlook for November 20
The bearish case is a break under $1,717 and $1,700, which could lead to another test of lower levels. The stabilizing case is a base between $1,717 and $1,770. The recovery case requires ETH to retake $1,770 and then hold above $1,800. Each case depends on what the market does next, rather than an assumed outcome.