
 Bitcoin market price and chart’s biggest warning is not another sudden red candle. It is the combination of heavy withdrawals from U.S. spot Bitcoin funds, weak risk appetite following a Wall Street selloff and a futures market still carrying considerable exposure. Bitcoin was quoted near $75,300 on November 8, a modest 0.48% decline over 24 hours, suggesting the latest market anxiety reflects the aftermath of a difficult week rather than a fresh one-day collapse.
The latest CoinGlass Bitcoin futures dashboard put BTC open interest at $51.21 billion. Separately, Farside Investors’ fund-level records show $411.9 million in net outflows on November 6. Read together, these measures help explain why the question why is crypto crashing today persists despite Bitcoin’s relatively small latest daily move. Neither figure, on its own, establishes why an individual investor sold.
Why Is Crypto Crashing Today Amid Wall Street?
The most visible turning point was November 5, when a selloff in U.S. equities spread across technology and other risk-sensitive assets. The Nasdaq Composite lost approximately 5.5% and the S&P 500 fell about 4.4% that session. Bitcoin also declined sharply as investors reconsidered exposure to volatile assets. The overlap is consistent with a broad reduction in risk, although synchronous price movements do not prove that stock selling directly caused every crypto transaction.
Cboe’s own volatility data show the VIX finishing November 5 at 28.18 before easing to 25.64 on November 6. The U.S. Bureau of Labor Statistics also reported 165,000 jobs added in October, introducing another data point for markets assessing the monetary-policy outlook. A volatility shock and uncertain expectations can make leveraged positions harder to maintain, but they cannot be reduced to a single cause of Bitcoin’s decline.
Why Is Crypto Crashing Today Following ETF Outflows?
Fund flows supply a clearer measure of pressure from one part of the market. Farside’s U.S. spot Bitcoin ETF table recorded net withdrawals of $398.6 million on November 2, $115.6 million on November 3, inflows of $74.6 million on November 4, then outflows of $430.2 million and $411.9 million on November 5 and 6, respectively. Those five sessions sum to approximately $1.28 billion in net outflows.
BlackRock’s IBIT accounted for $403 million in outflows on November 6, partly offset by $42.8 million of inflows to Fidelity’s FBTC. The figures concern ETF fund flows, not direct evidence that the same dollar amount of Bitcoin was immediately sold on exchanges. BlockBriefing previously explained the accounting distinction in its Bitcoin ETF inflows and outflows guide.
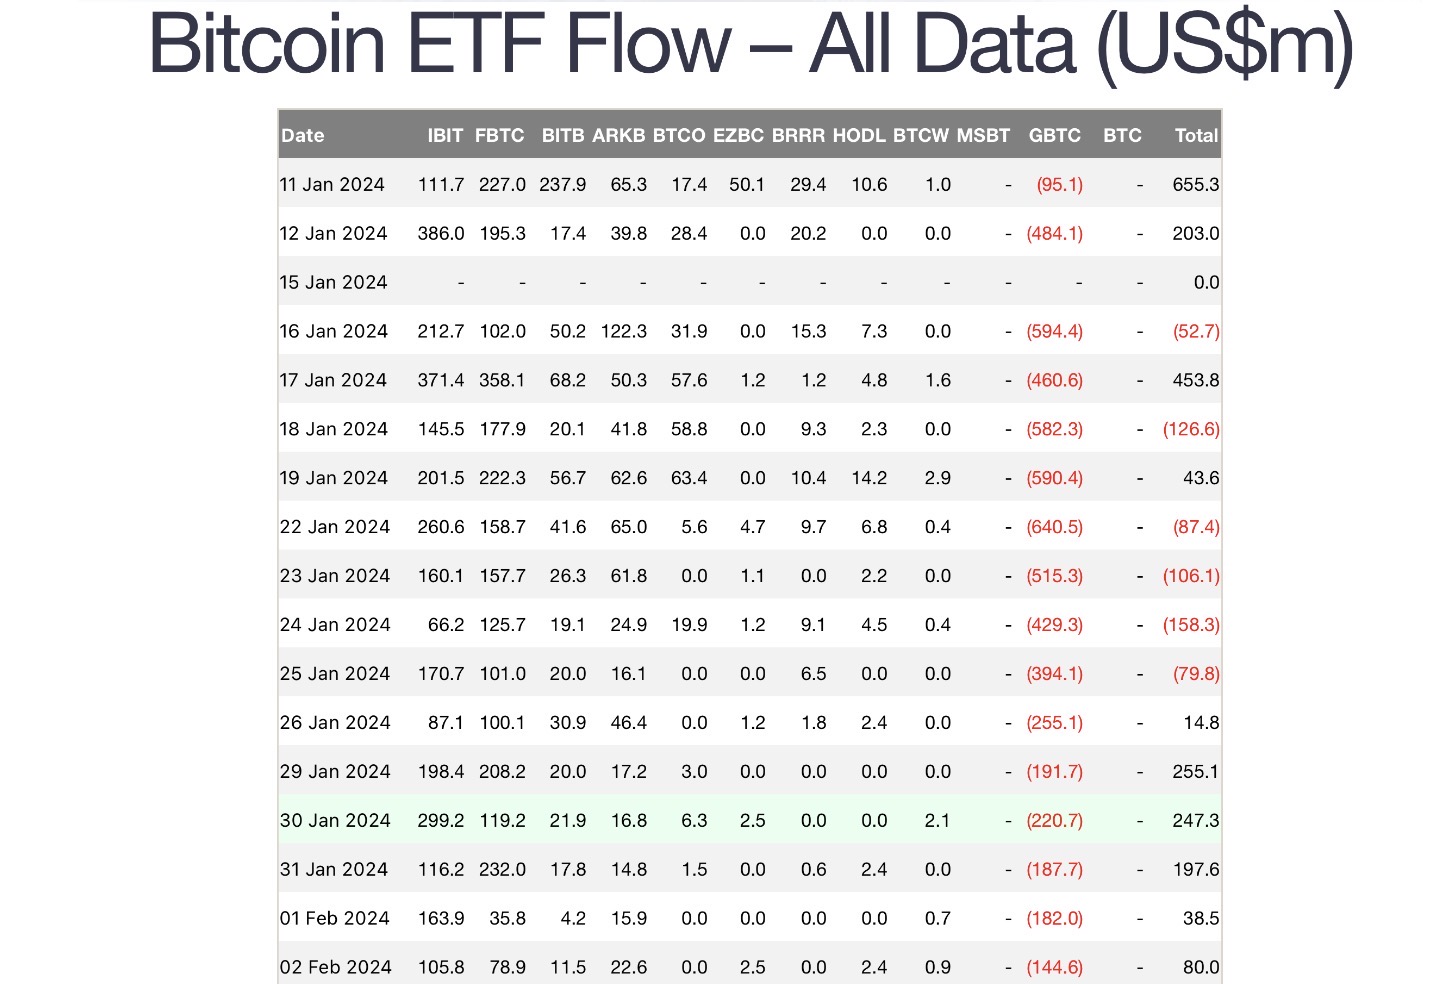
The Farside table screenshot below shows historical fund-level entries from January and February 2024. It illustrates the reporting format but does not display the November 2026 flows cited above. Those figures should be checked against the current Farside flow table.
What CoinGlass Liquidations Reveal About Market Positioning Today
The latest CoinGlass liquidation dashboard showed approximately $61.97 million of crypto derivatives positions liquidated over its rolling 24-hour window, split between $37.86 million in longs and $24.11 million in shorts. That makes long closures roughly 61.1% of the total. CoinGlass counted 55,224 affected traders in the same observed snapshot.
| Market indicator | Observed value | What it measures |
|---|---|---|
| Bitcoin price | $75,300.50 | CoinGlass BTC reference quote |
| BTC 24-hour price change | -0.48% | Rolling quoted price change |
| BTC futures open interest | $51.21 billion | Outstanding BTC derivatives contracts |
| BTC futures volume, 24h | $19.27 billion | Reported futures turnover |
| Crypto liquidations, 24h | $61.97 million | Rolling forced closures across tracked markets |
| Long / short liquidations | $37.86M / $24.11M | Closures of bullish / bearish leveraged positions |
| Fear & Greed Index | 28, Fear | Alternative.me sentiment reading, not a CoinGlass value |
The smaller rolling liquidation total should not be conflated with the much larger liquidation waves reported during the earlier selloff. Liquidations measure forced derivatives closures rather than the value of every coin sold on spot markets. For the underlying mechanics, see BlockBriefing’s liquidation and margin explainer.
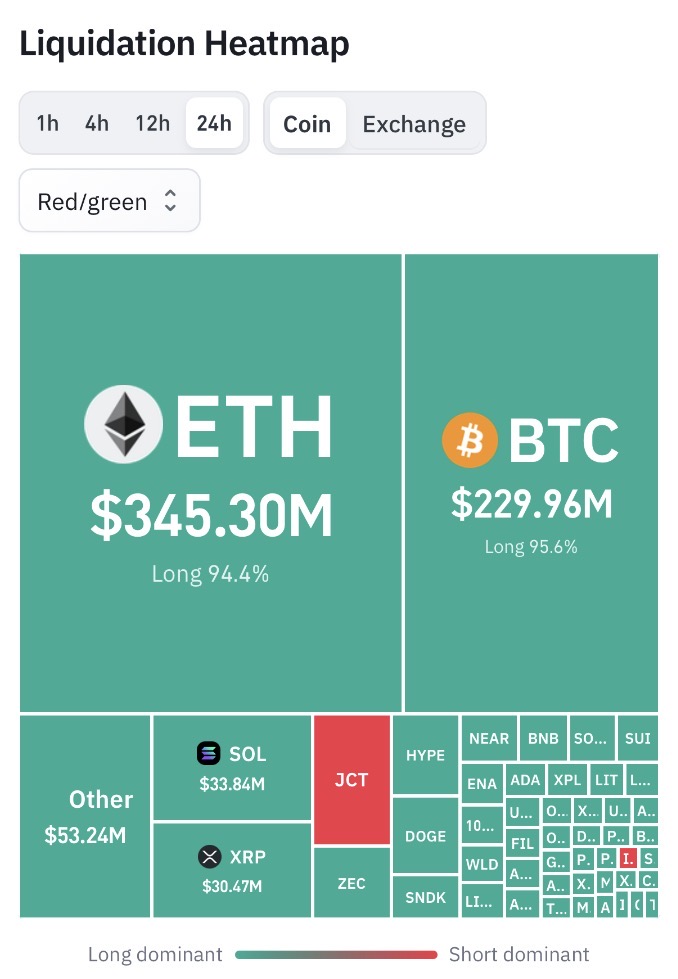
The supplied CoinGlass heatmap screenshot, shown below, displays $345.30 million in  ETH market price and chart and $229.96 million in BTC liquidations, with longs accounting for more than 94% for each asset in that chart. Its capture time is not visible, so this separate rolling-window snapshot must not be treated as the same observation as the $61.97 million figure reported above.
How Futures Open Interest Changes The Risk Picture
CoinGlass separately reported $19.27 billion in 24-hour BTC futures turnover and $1.41 billion in spot turnover on its BTC page. Open interest of $51.21 billion shows the notional scale of outstanding contracts, but cannot identify whether the next forced closing will involve more longs or shorts. Each futures contract has parties on both sides, making it misleading to equate aggregate open interest with net bullish conviction.
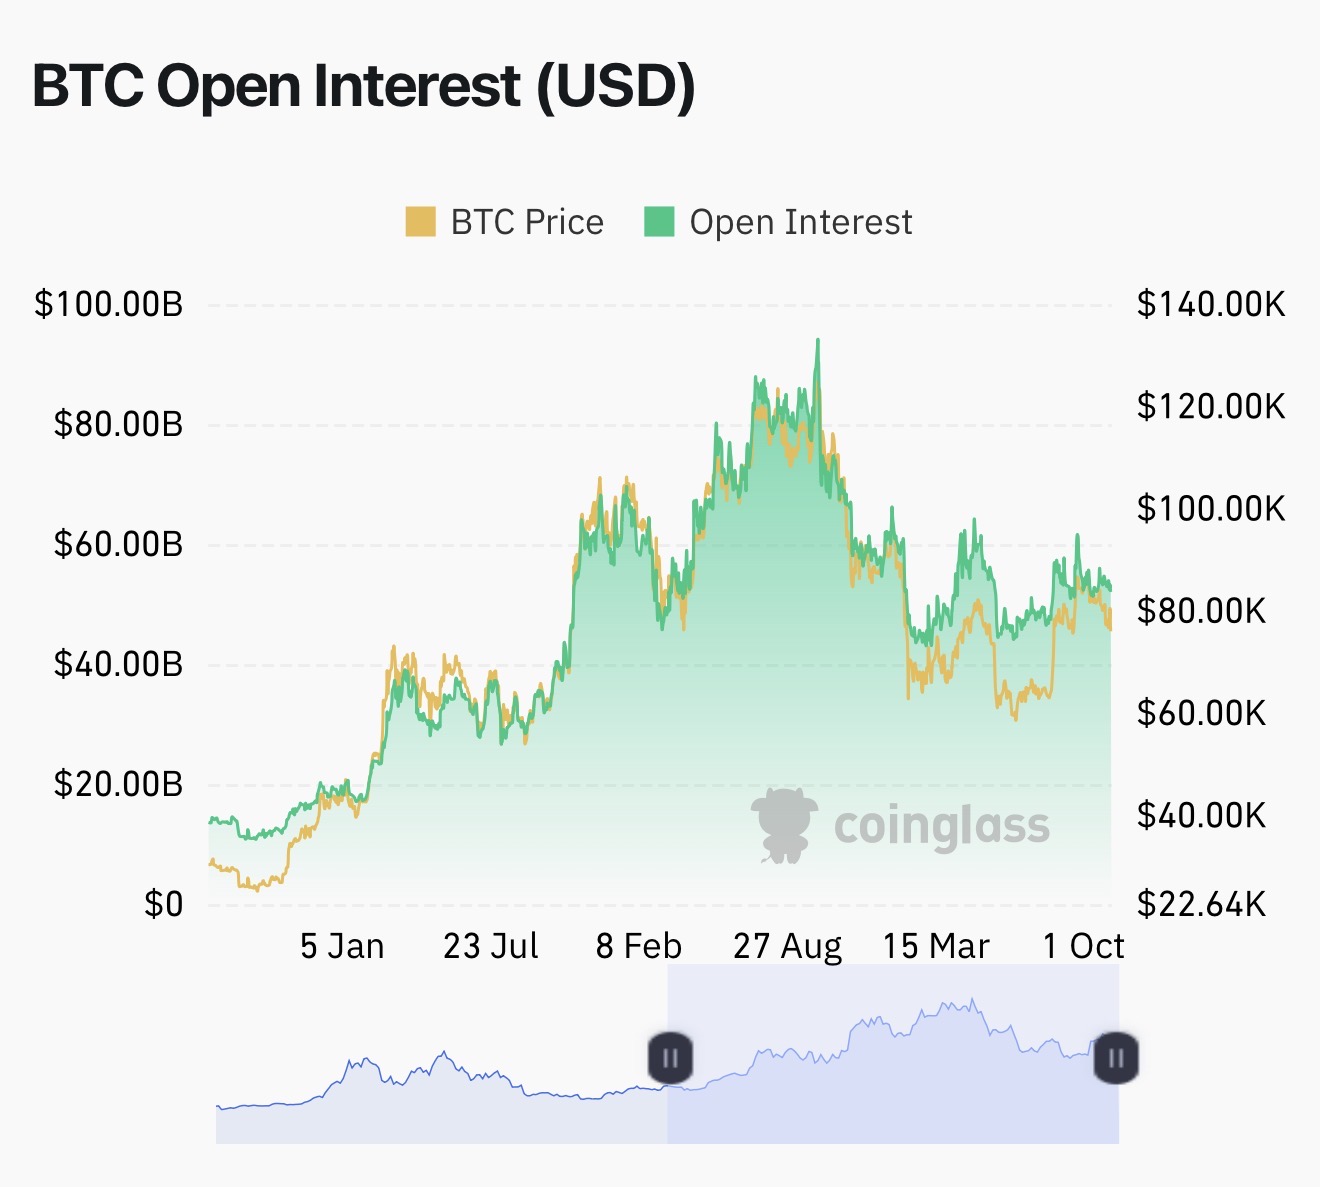
The following CoinGlass chart compares historical Bitcoin futures open interest with BTC price. It helps show how leverage exposure has fluctuated over time, but the visible date labels do not establish its exact latest observation time.
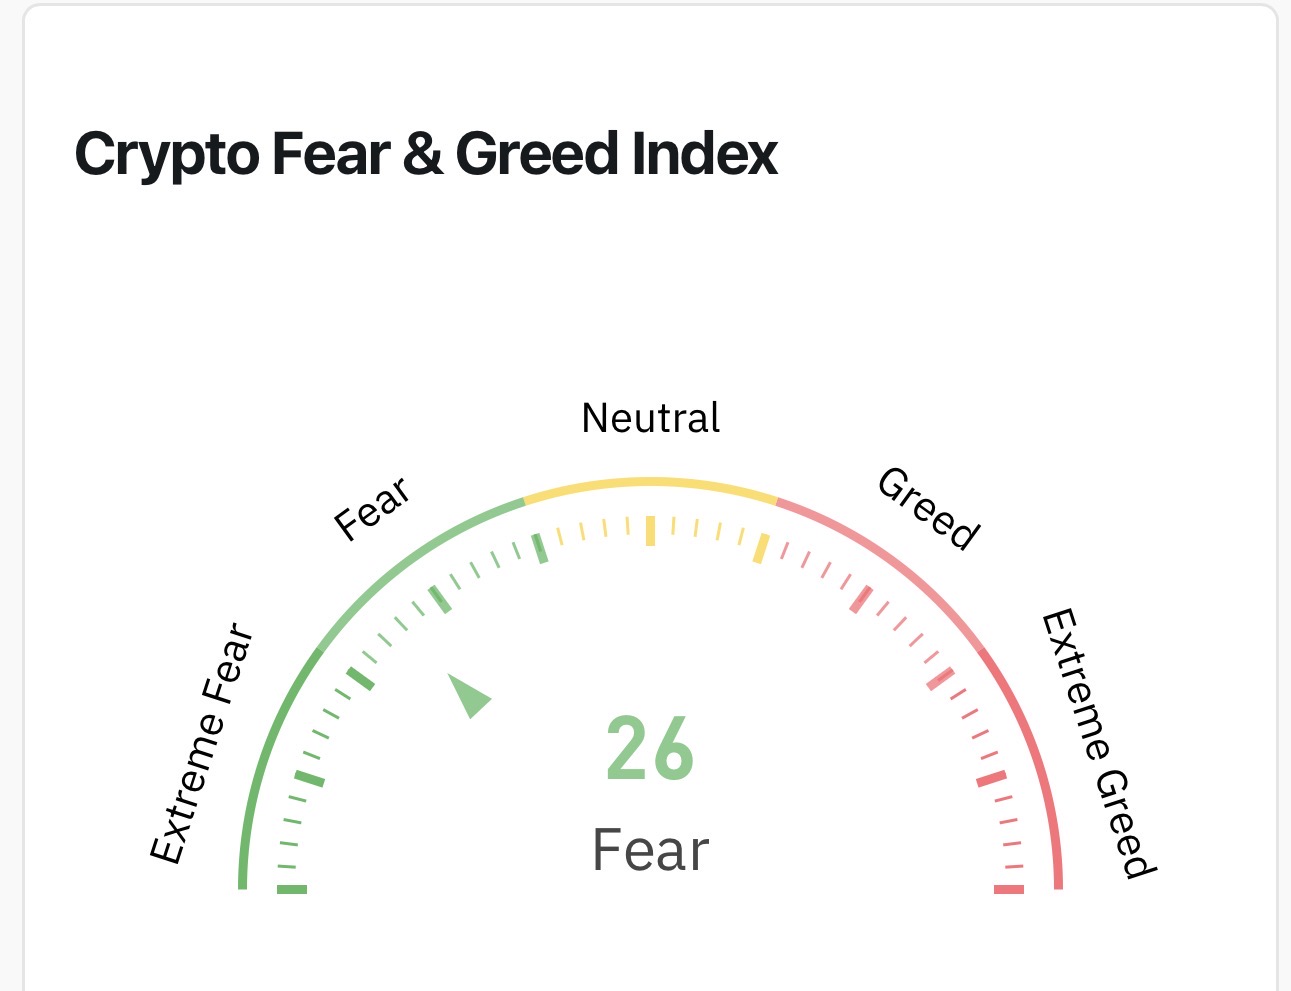
Alternative.me’s Fear & Greed Index stood at 28, classified as Fear, after an earlier reading of 25 in Extreme Fear. The separately supplied CoinGlass sentiment chart shows 26, also labeled Fear. As its observation time is not visible in the screenshot, the two index readings are reported separately rather than treated as simultaneous measurements.
Could Crypto Rover’s Short Squeeze Scenario Materialize Soon?
In a November 8 post on X, analyst Crypto Rover argued that Bitcoin net shorts were at a historic extreme and longs were unusually low. He interpreted the setup as a possible precursor to a short squeeze. The accompanying chart plots BTC/ USDT market price and chart on an eight-hour interval above a CoinGlass net-shorts indicator and highlights several earlier instances where an elevated reading appeared near price lows.
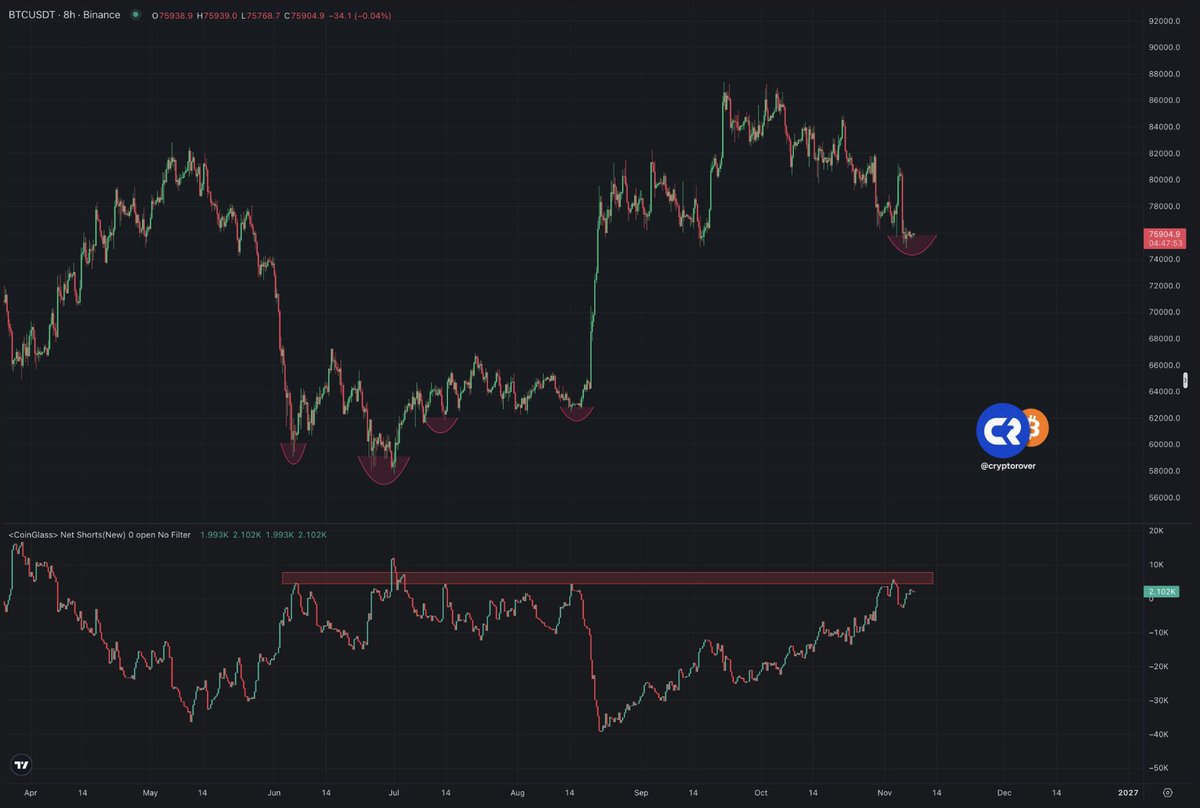
The potential mechanism is straightforward. If Bitcoin rallies enough to pressure bearish leveraged accounts, forced short buying can add momentum to the advance. But Rover’s chart does not independently establish an all-time record across every futures venue, and earlier correlations are not evidence that another bottom is confirmed. A sustained recovery through the nearby $76,000 area would provide more observable confirmation than short positioning alone; renewed weakness below the recent $74,888 reference low would challenge the rebound interpretation.
What Altcoin Daily’s Video Suggests About Selling Today
The November 5 Altcoin Daily video, The Real Reason Crypto Is Crashing, frames the drawdown within wider equity-market stress. Its published chapter markers focus on the stock-market selloff at 00:29, historical midterm-election declines at 01:42, the VIX surge at 03:06 and potential crypto purchases at 04:32. Those topics align with verifiable volatility data, although the video’s advertised stock-market loss estimate and VIX historical ranking are not independently verified here.
As an editorial interpretation, the discussion is useful for understanding why macroeconomic developments matter to crypto prices. Its suggested purchases are opinion, not evidence that the market has reached a bottom. The original video is embedded below for readers to review the arguments in context.
What Bitcoin Must Recover To Stabilize Current Prices
The next test is whether buyers can hold recent lows and recover higher levels with sustained trading activity. BlockBriefing’s earlier independent BTC/USDT candle analysis documented a provisional $74,888 low and a completed November 5 close of $76,088. Those are historical exchange observations, not guaranteed support or resistance. Current futures positioning makes both a continued selloff and a short-covering rally plausible.
For now, the answer to why is crypto crashing today is a combination of observable factors: a sharp recent cross-market risk retreat, persistent ETF redemptions, nervous sentiment and leverage that may amplify price movements. Which factor dominates the next move cannot be determined from a single tweet, chart or rolling 24-hour reading.
Methodology: CoinGlass figures were checked around November 8, 2026, 22:23 UTC and can change with live updates. ETF flows cover completed U.S. sessions from November 2 through 6. Historical BTC candle levels refer to the cited BlockBriefing research cutoff and may differ from the current BTC reference quote. This is analysis, not investment advice.