
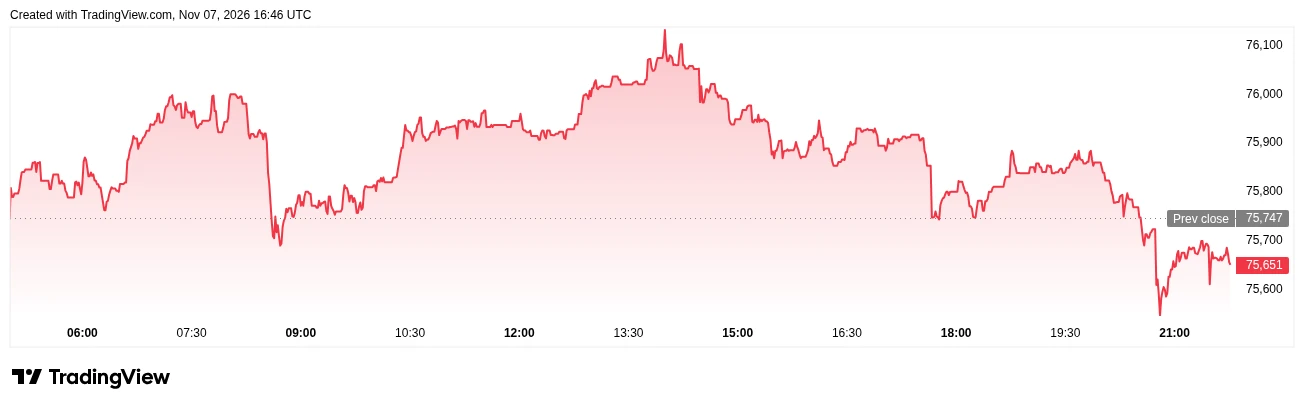
 Bitcoin market price and chart traded around $75,800 on November 8 after a steep midweek decline left the cryptocurrency below $80,000. A narrow trading range has put two competing possibilities in focus: a broader recovery after the selloff or a short-term liquidity sweep before direction becomes clear.
In a November 8 post, Gordon said Bitcoin had entered a recovery phase and that the larger bull-market advance had yet to arrive. Meanwhile, Daan Crypto Trades cautioned that sideways trading had built liquidation exposure above and below spot prices. Neither view establishes that a trend reversal is already confirmed.
Bitcoin Stabilizes After Sharp Multi Session Price Decline
TradingView’s Bitcoin market page showed modest short-term movement against a negative weekly trend. Bitstamp BTC/USD completed daily candles closed around $80,434 on November 4, $75,971 on November 5 and $75,747 on November 7. Bitcoin traded below $75,000 on November 6 before recovering into its recent range.
Price stabilization after a selloff does not by itself establish a lasting recovery. The November 8 daily candle remains provisional until the UTC close, making the difference between an intraday bounce and a confirmed closing price important.
Gordon Expects Recovery Before Another Major Bitcoin Advance
Gordon’s November 8 statement argues that the latest consolidation belongs to a recovery phase ahead of a larger bull-market move. That is a directional opinion rather than evidence of confirmed buying demand or a numerical price target.
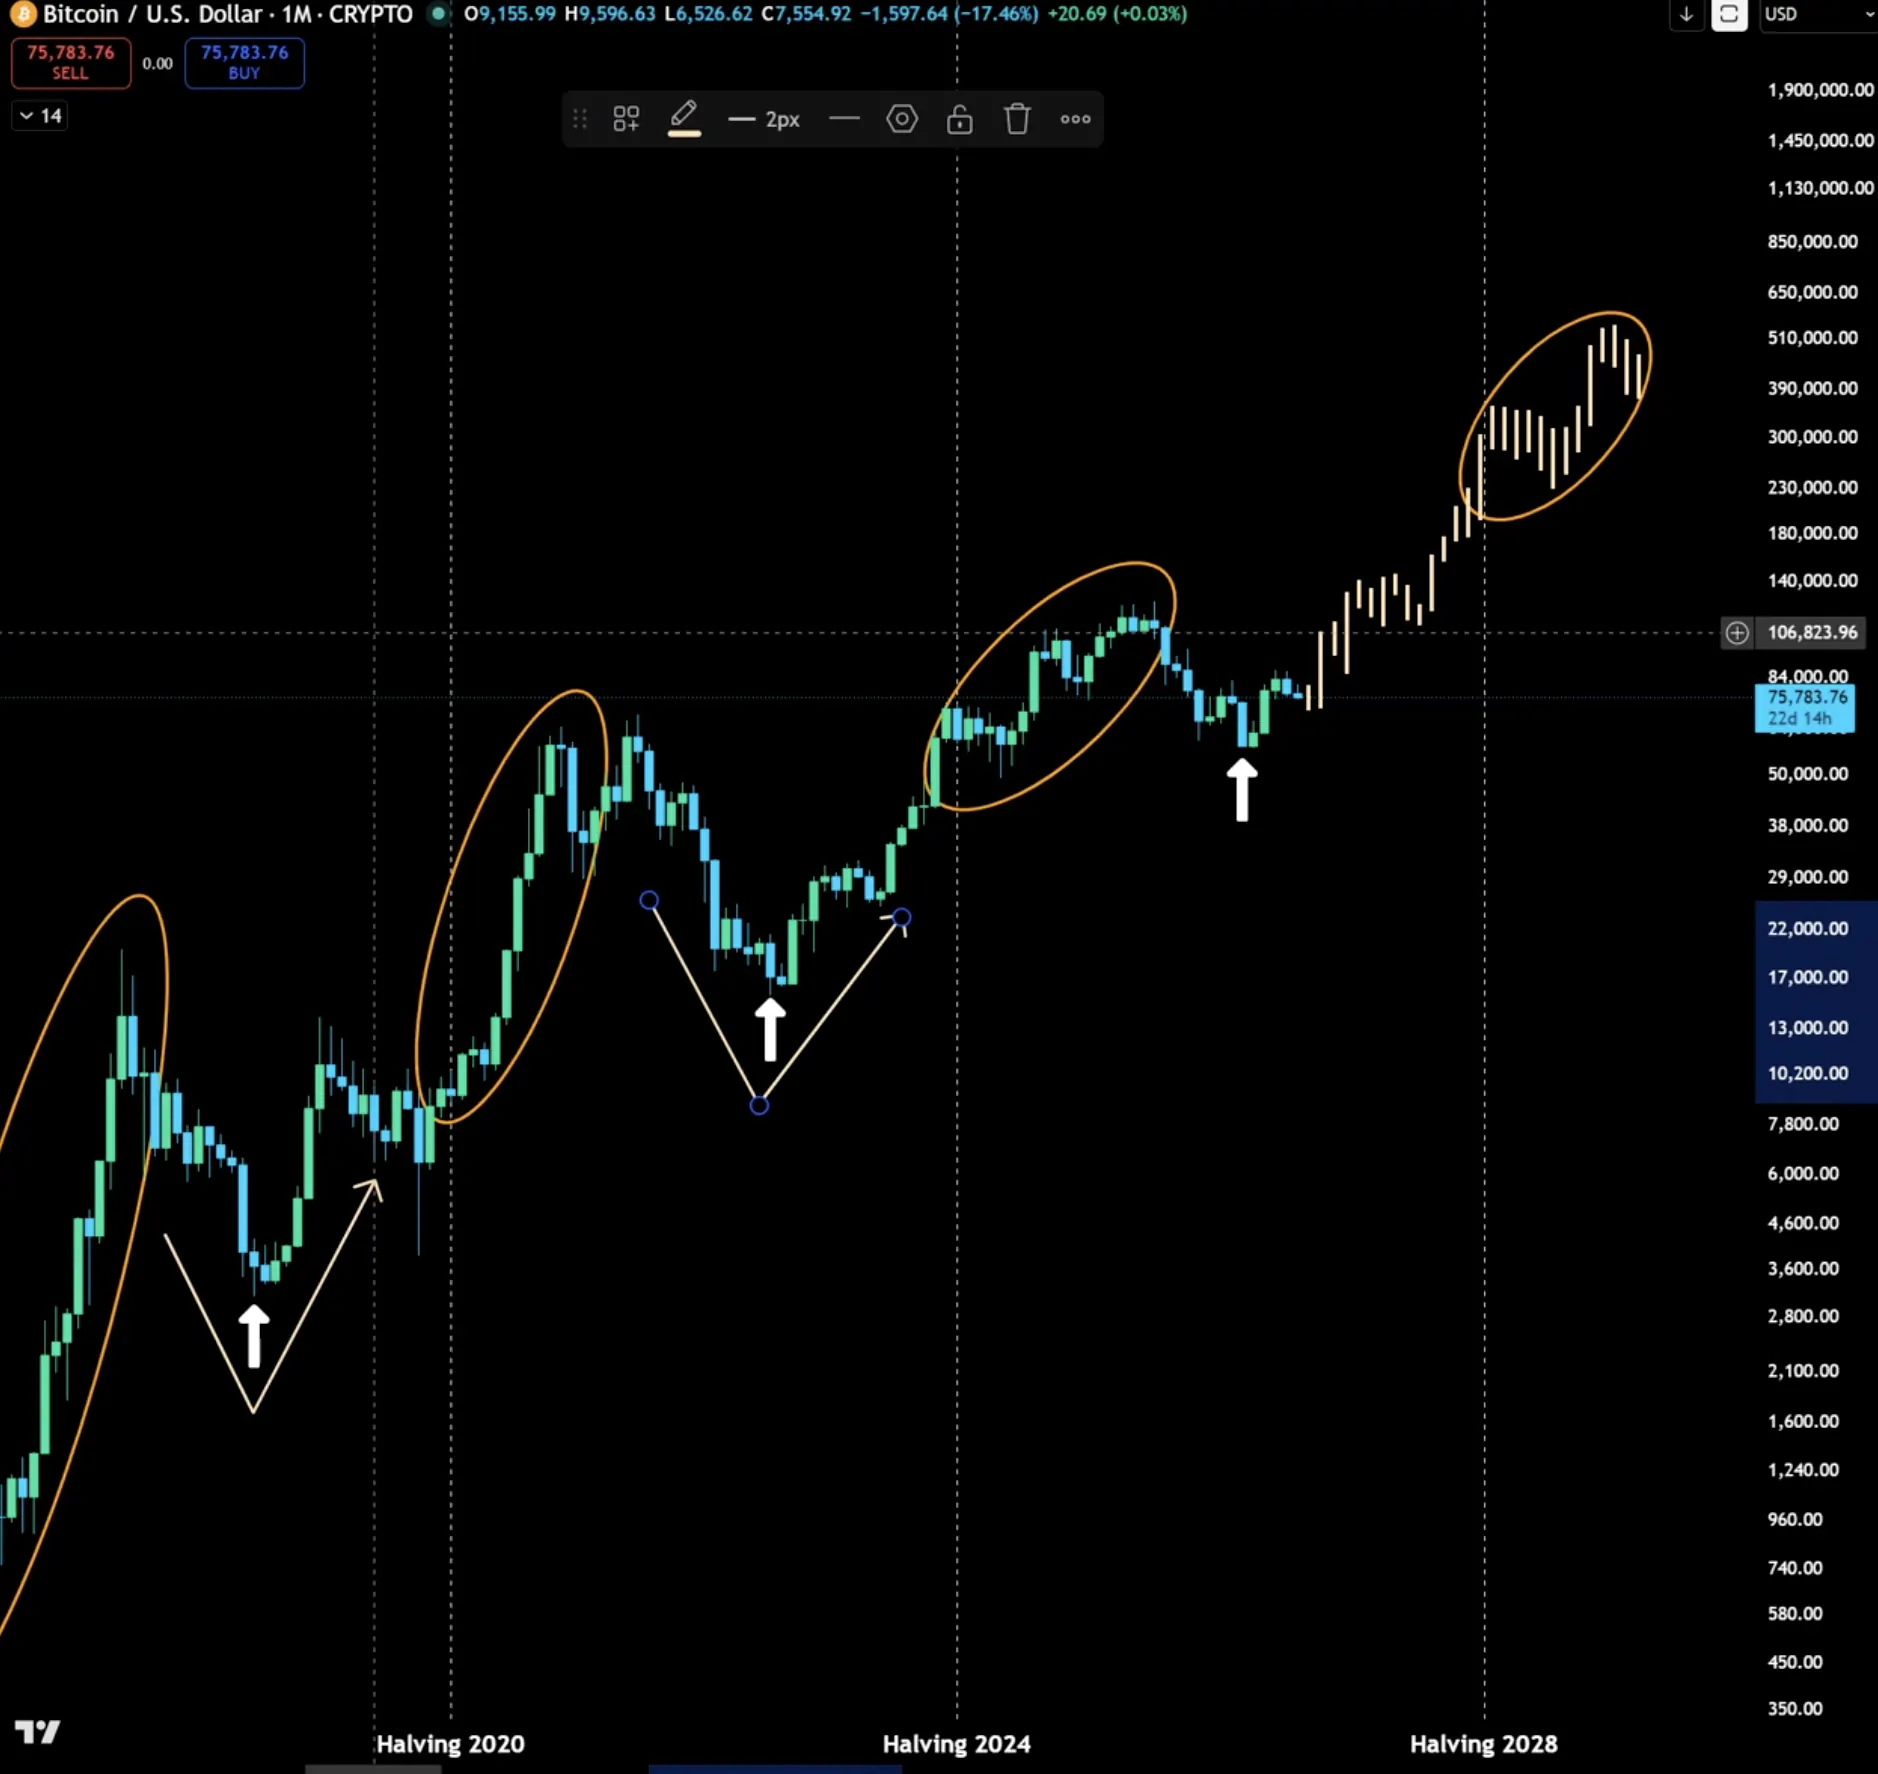
A long-term monthly Bitcoin chart supplied with this analysis compares prior market cycles around the 2020 and 2024 halvings and sketches a potential advance toward the 2028 halving. Its white future candles and orange annotations depict a hypothetical scenario, not observed future prices or a guaranteed replay of earlier cycles.
The price structure would need stronger closes above recently lost levels to support the bullish argument. Historical cycle similarities alone cannot establish that the next expansion will follow the same timing or magnitude.
Daan Warns Liquidity May Be Swept Both Ways
In his November 8 update, Daan Crypto Trades described two quieter trading sessions after the midweek drop, noting that positions had accumulated on both sides. His scenario allows for price to move through nearby liquidation concentrations before a clearer direction develops.
The accompanying Coinglass heatmap highlights modeled leveraged liquidations around Bitcoin’s recent range, with visible concentrations below $75,000 and above $76,000. The bands represent estimated liquidation exposure, not verified spot orders or fixed price targets.
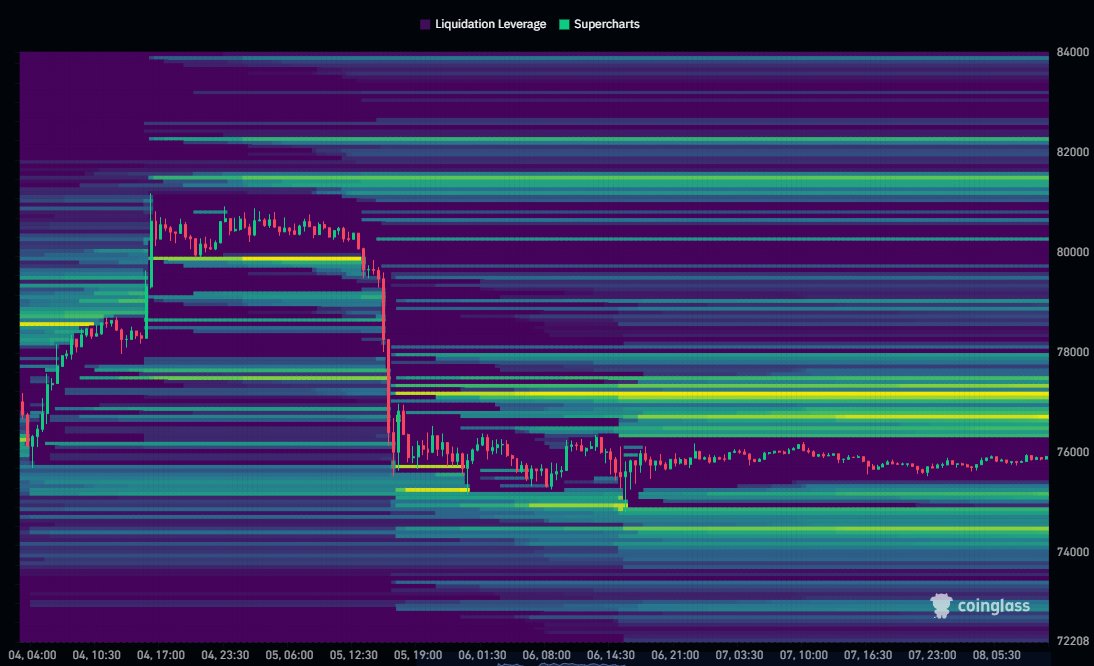
A short-lived breakout could therefore liquidate traders without proving that a sustainable trend has started. This short-term risk can coexist with Gordon’s longer-term bullish outlook.
SoSoValue Records Heavy Spot Bitcoin ETF Fund Withdrawals
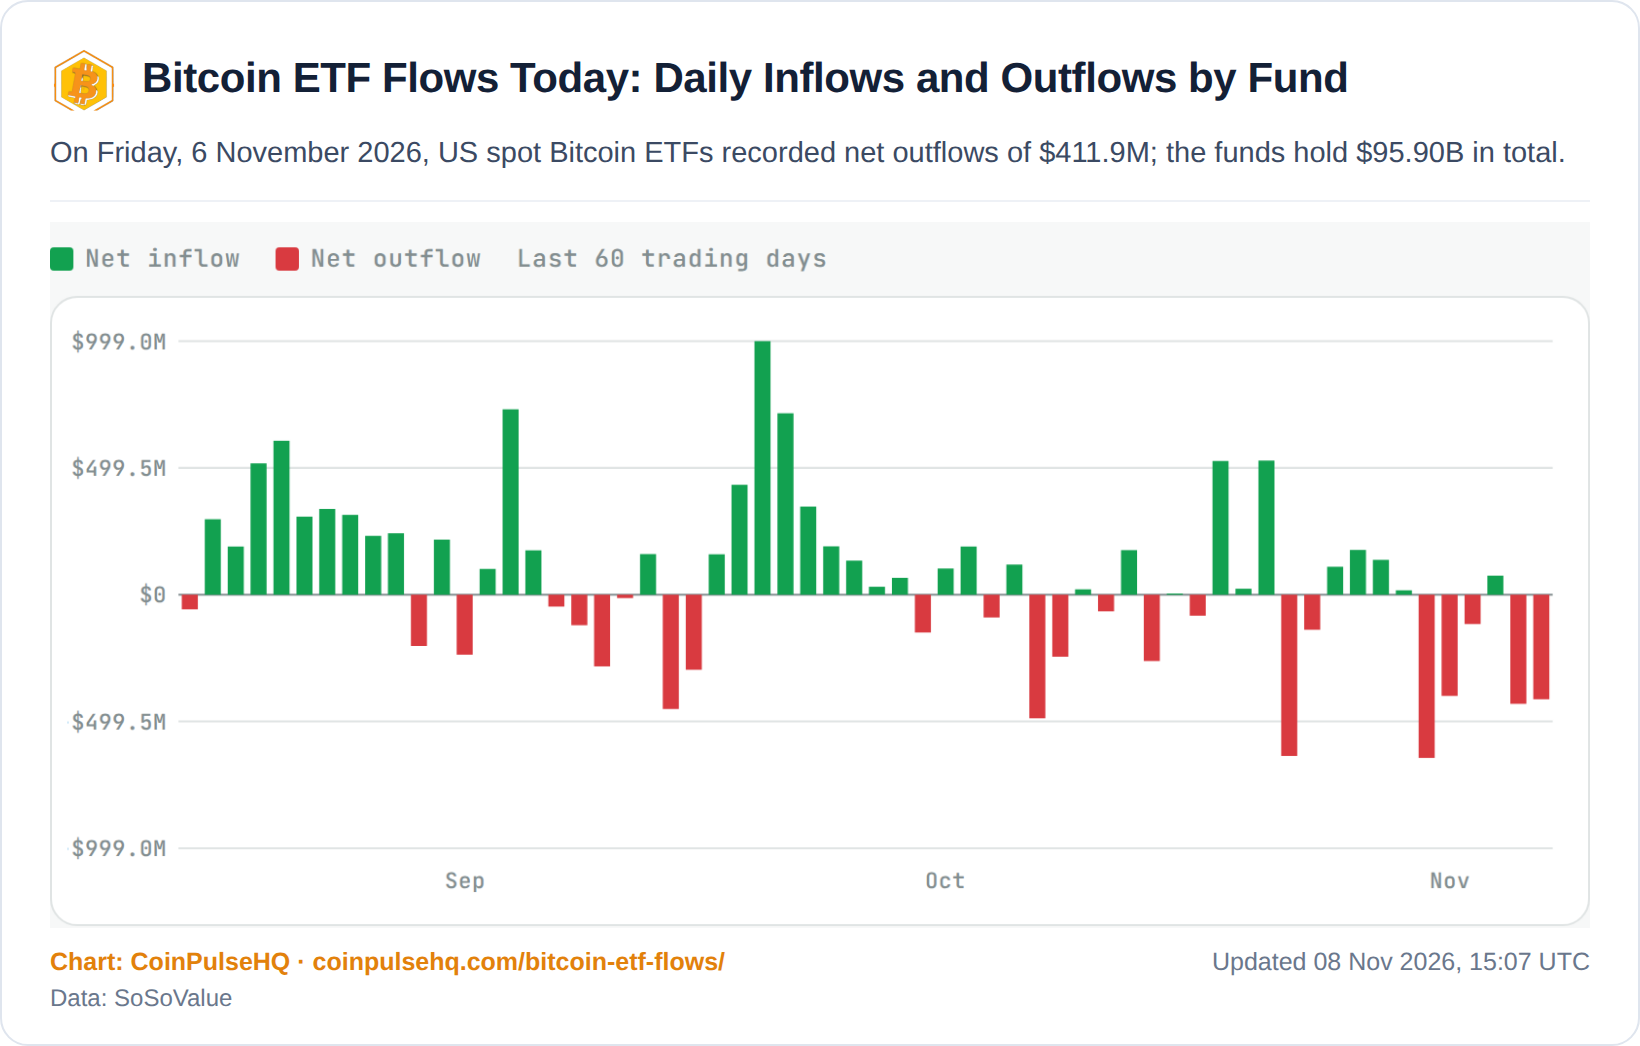
SoSoValue data put net US spot Bitcoin ETF outflows near $411.92 million on November 6, following approximately $430.2 million on November 5. Across November 2–6, the reported five-session total was about $1.28 billion in net withdrawals.
BlackRock’s IBIT accounted for roughly $403 million in outflows on November 6, while Fidelity’s FBTC recorded approximately $42.82 million in inflows. Aggregate net assets were around $95.9 billion, and cumulative net inflows since launch stood near $55.7 billion.
| Session | ETF net flow |
|---|---|
| November 2 | −$398.6M |
| November 3 | −$115.6M |
| November 4 | +$74.6M |
| November 5 | −$430.2M |
| November 6 | −$411.92M |
| Five-session total | About −$1.28B |
Fund redemptions measure net ETF flows, not all Bitcoin demand. They nevertheless indicate that ETF demand was under pressure during the latest completed US market sessions.
Price Confirmation Remains Essential As Bitcoin Tests Buyers
For now, the observable picture is a fragile consolidation following a steep decline. Gordon’s recovery thesis requires stronger follow-through, while Daan’s heatmap suggests a temporary move through leveraged positions could occur before a sustained trend emerges.
Readers should distinguish measured spot prices, estimated liquidation levels, ETF fund flows and speculative long-term chart projections. These are different types of evidence and should not be treated as interchangeable signals.
Data note: Bitcoin spot prices are sourced from the linked market provider; completed candle references use UTC sessions. ETF figures end November 6. This report is not investment advice.