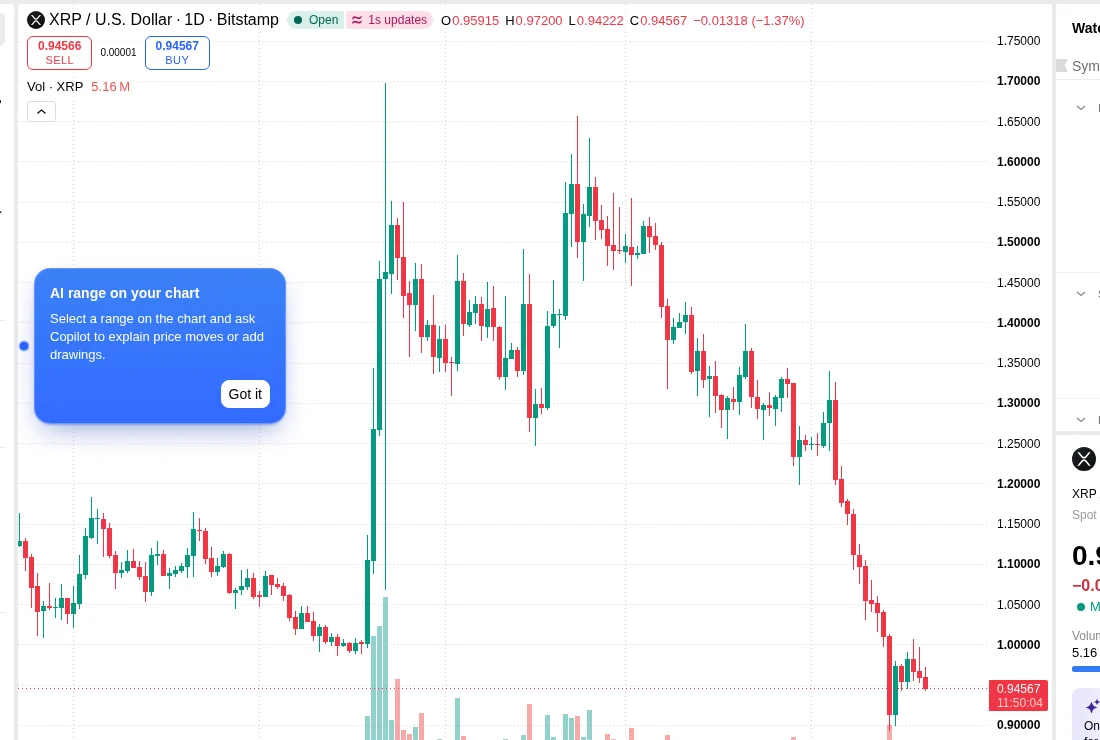
XRP was near $0.946 on the Bitstamp XRPUSD TradingView daily chart captured around 12:10 UTC on November 20, 2026, still below the $1 threshold. An earlier TradingView Binance XRPUSDT perpetual-market table had shown approximately $0.985. The separate prices reflect distinct instruments and observation times; the screenshot provides the later chart reference. The short-term question is whether the rebound can persist toward $0.99 and $1, or whether selling returns above the day’s lower range.
The TradingView XRP markets table showed Binance’s XRPUSDT perpetual contract near $0.9846, with an observed trading range of $0.9451 to $0.9911 and a roughly 3.16% gain at the reviewed data point. Those figures are for one derivatives market and should not be presented as a universal XRP spot quote.
Why is XRP struggling below one dollar?
One dollar is a round-number barrier that market participants can recognize without a chart. After an asset falls beneath such a level, rebounds often face close attention there. That does not mean a single large seller or an unverified wall of limit orders is responsible.
Recent market behavior leaves XRP trying to build a base under that threshold. A short-term recovery can begin before the wider trend improves. A more meaningful shift would require price to make higher lows and then remain above an important resistance zone.
Where are XRP support and resistance?
The earlier session’s first support reference was $0.947 to $0.950; the later Bitstamp screenshot around $0.946 shows that area under renewed pressure. If that area fails, $0.93 and then $0.90 become possible price zones for traders to monitor. Those lower levels are round-number scenarios, not independently measured order-book demand.
Price has already recovered through $0.975 in the reviewed Binance perpetual-market snapshot. The immediate upward test is now $0.99 to $0.991, near the observed session high, followed by $1.00. A move briefly touching $1 would not be the same as accepting it as a new support level.
What does the technical trend say?
TradingView’s longer-period performance shows XRP down substantially over the last month. That means the daily chart deserves more weight than an isolated positive fifteen-minute candle. Even when a market is deeply sold off, a one-hour bounce does not, by itself, erase an extended decline.
The public TradingView indicator table did not expose numeric RSI, moving-average or MACD readings at the time of this review. For that reason, the analysis does not assign an invented RSI reading or describe a verified crossover. It focuses instead on observed price zones and the conditions for confirmation.
Could XRP recover above one dollar?
That outcome remains possible, but a recovery sequence matters. First, XRP needs to defend gains above roughly $0.975 and then clear $0.991. It would next need to overcome the $1.00 region. A series of closes above the round number would offer stronger evidence of a shift than one sudden wick.
The downside case begins with rejection near $0.99 followed by a reversal below $0.975 and then $0.945. The neutral case is consolidation in between while activity slows. Those paths are alternatives rather than predictions assigned unsupported probabilities.
What should XRP holders watch next?
The main factors are sustained trading above or below the day’s range, changes in volume and whether broader Bitcoin selling pressure eases. BlockBriefing’s November 19 XRP price analysis covered the previous session. Today’s edition updates the focus to whether support near $0.95 can hold while the $1 level remains overhead.