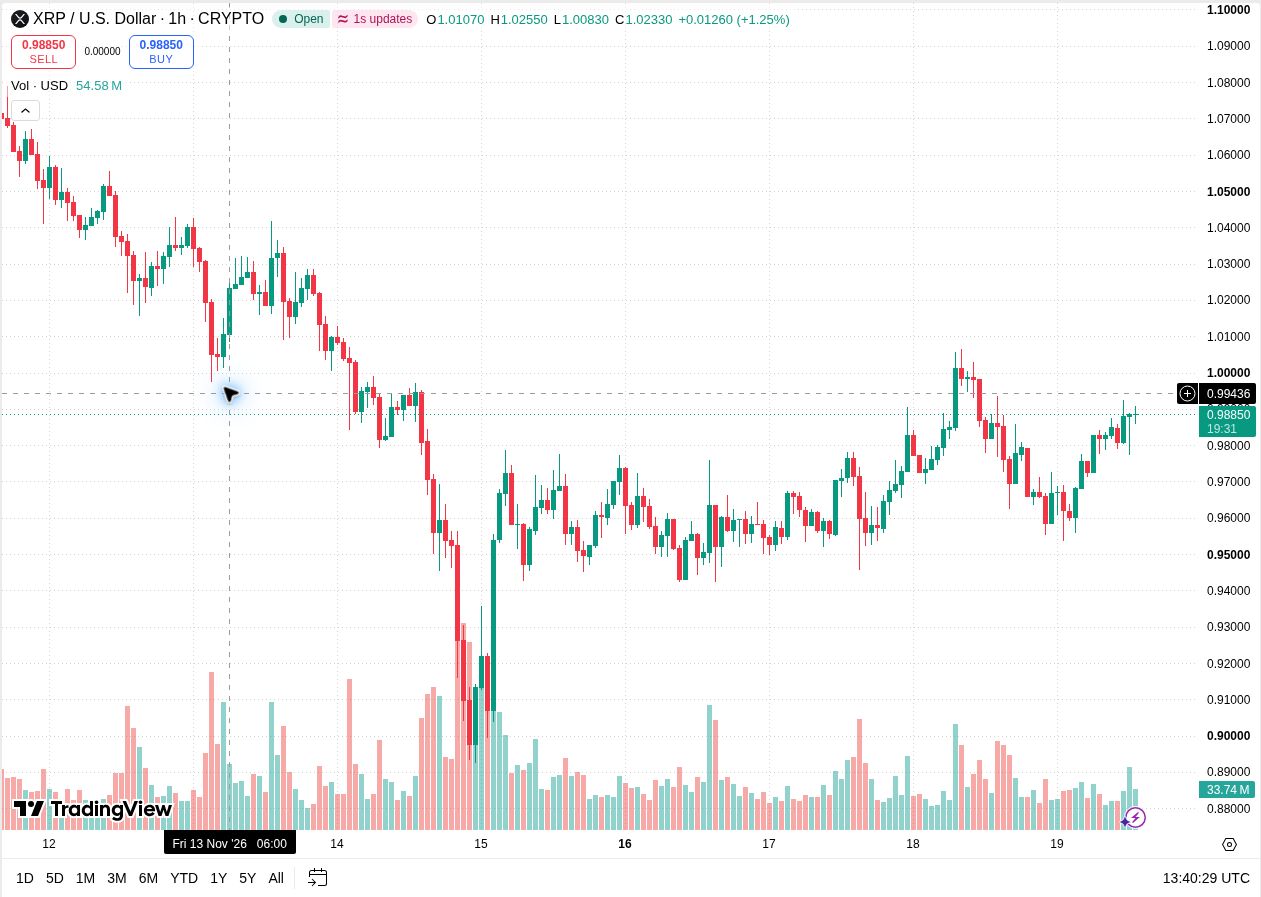
XRP traded at $0.98850 on November 19 after recovering from around $0.96. The move brought it back within roughly 1.2% of $1. The chart shows why that level matters. The previous session briefly pushed above it before selling carried the price back into the $0.90s.
TradingView’s XRP/USD hourly chart shows XRP climbing toward $0.99, with several recent candle bodies around $0.98 to $0.99. The latest price sat just below $0.99 at the time of capture. The chart also shows a prior November 18 wick above $1, which gives the rally a nearby point of comparison.
XRP price analysis puts $0.99 and $1 in focus
The recent recovery has formed a series of higher lows from around $0.96. Its latest candles are starting to bunch up near $0.99. That can happen when a rising market reaches earlier sellers. Whether the next candle closes above that area matters more than whether its wick crosses it briefly.
XRP support and resistance levels
The first upside checkpoint is around $0.99. Above that, $1 is the next major reference, followed by the prior wick near $1.01. A market that closes above $1 and holds it on a pullback would show a stronger recovery than the November 18 move, which crossed the level and quickly gave it back.
If the bounce loses pace, around $0.98 is the first area to watch. The hourly chart shows several candles building there as price moved higher. Below $0.98, $0.97 and then the $0.96 area are references from the earlier rebound. A close back under $0.98 would make those levels more relevant.
At the snapshot price, XRP was only $0.0015 below $0.99 but still $0.0115 below $1. Those distances put the two tests in perspective. XRP can cross $0.99 within the range of a small hourly candle and still face the area where the prior session’s breakout failed.
The prior move above $1 gives readers a concrete test. If XRP crosses $1 again, watch where the candle finishes and where the next dip finds buyers. A wick through $1 that closes back below would repeat the earlier pattern. A close above $1 followed by a higher low near it would show that buyers have held ground the previous rally gave up.
What would confirm the next XRP move?
- A close above $0.99 would bring $1 into play. A later pullback that holds above $0.99 would make the recovery easier to follow.
- A break below $0.98 followed by a failed bounce could send price back toward $0.97 and the earlier support near $0.96.
The broader chart still shows XRP falling from above $1.05 earlier in the displayed week. Reaching $1 would recover part of that decline. The more telling signal would be whether buyers can defend the levels they reclaim, especially if price moves back through the same range where the previous rally stalled.
Read the November 18 XRP price analysis for the previous session’s levels.