
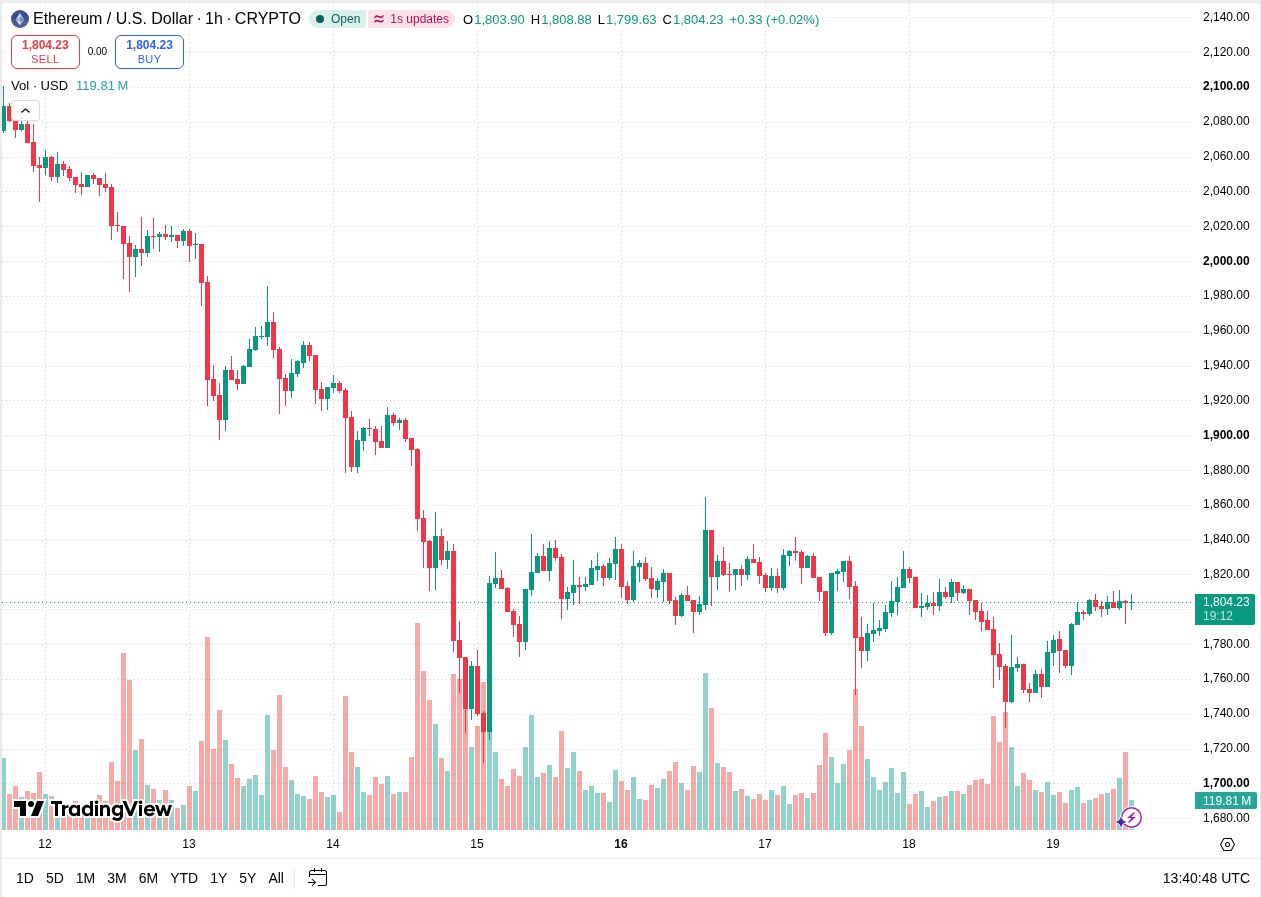
Ethereum traded at $1,804.23 on November 19 after recovering from the mid-$1,700s. ETH moved back above $1,800, but the current hour had already dipped below that level before recovering. The next test is whether buyers can defend $1,800 through a completed candle and challenge the prior highs near $1,820.
TradingView’s ETH/USD hourly chart showed the 13:00 UTC candle open at $1,803.90, reach $1,808.88, and dip to $1,799.63 by 13:40 UTC. Its price had returned above the open by the snapshot. The range shows how closely sellers and buyers were contesting the $1,800 level.
Ethereum price analysis tracks the $1,800 retest
Ether’s rebound advanced through the upper $1,700s before several candles began to overlap around $1,800. One of the recent wicks reached toward $1,790, where price turned higher. That gives readers a small zone to watch around the round number, especially if the next pullback comes after a move toward $1,810.
Ethereum support and resistance levels
The first nearby resistance is around $1,809 to $1,810. It sits near the current hour’s high and the top of the recent candle cluster. A move through that area would bring $1,820 into view, where ETH traded in the preceding sessions. The chart shows another group of earlier highs near $1,830 to $1,840.
If $1,800 gives way, the chart puts the first downside reference near $1,790 and the next around $1,780. Below that, the zone near $1,750 to $1,760 includes candles from the earlier recovery. A move back into that zone would erase a larger share of the November 19 rebound.
The open hour had covered $9.25 from low to high. At the snapshot, ETH sat just $4.23 above $1,800. The difference is small compared with that candle’s range, so an intrahour print either side of $1,800 tells readers little on its own. A dip through the level followed by a close back above would show a different response from a candle that finishes near its low.
The $1,790 area gives the retest a second checkpoint. If that zone holds, buyers can still make a higher low before trying $1,810 again. Two attempts that stall around $1,810, followed by a break under $1,790, would show the rebound losing ground at both ends of the range.
What would confirm the next ETH move?
- A close above $1,810 and a pullback that holds near $1,800 would give the move more room to approach $1,820.
- A close below $1,790 followed by a bounce that stalls under $1,800 would signal that the market is having trouble keeping the recovered level.
The wider chart still records the selloff from above $2,000. A few hours near $1,800 only tell us what buyers have reclaimed so far. Watch where the next pullback ends and whether the next advance creates a fresh high. Those two tests can distinguish a short squeeze through a round number from a recovery that survives its first setback.
Read the November 18 Ethereum price analysis for the previous session’s levels.