
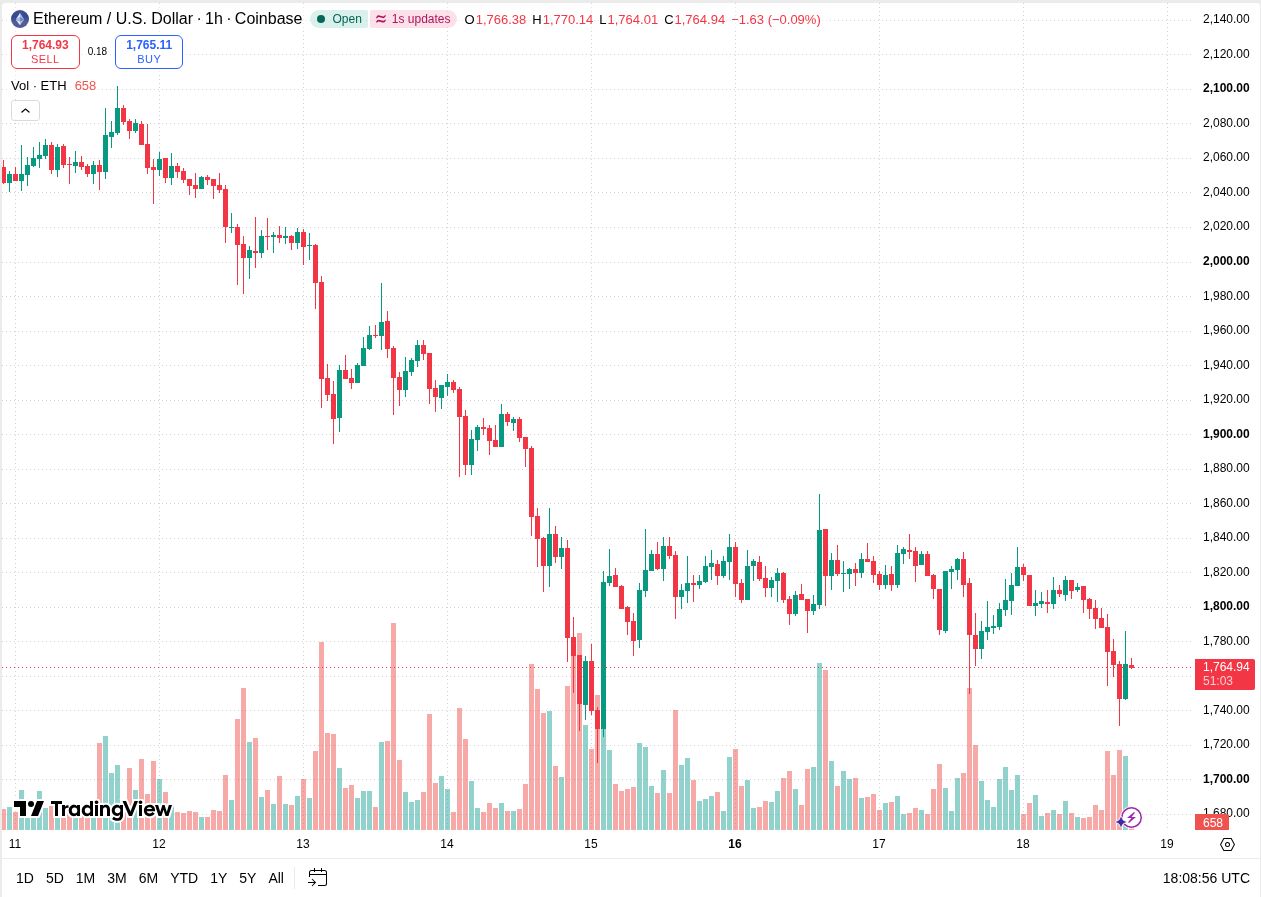
Ethereum bounced from around $1,730 on November 18 and was trading at $1,764.94 around 18:09 UTC. The rebound lifted ETH away from the low, but it was still below $1,770 and the $1,800 area it had lost earlier in the session.
The TradingView’s 1-hour ETH/USD chart showed the 18:00 UTC candle open at $1,766.38. The price reached $1,770.14 and fell as low as $1,764.01 by the time of the snapshot. The candle was still open, with Ether trading close to the bottom of that early range.
Ethereum price analysis tracks the $1,770 hurdle
The larger volume bars during the selloff show that trading picked up as Ether fell. A green candle followed the low near $1,730, while the next candle was trading slightly below its open. That puts the immediate focus on whether ETH can get through the high just above $1,770.
Where Ether needs to hold a rebound
A move above $1,770 would bring the area around $1,780 into focus. Several candles traded around that level during the descent. If Ether can clear it and pull back without losing the ground it made, the rebound would have more room to develop.
$1,800 is the next larger reference because the chart shows several candles trading on both sides of that level before the selloff. Beyond it, earlier November 18 highs sit around $1,820 to $1,830. Ether would need to recover the nearer levels before that band comes back into view.
Why $1,730 matters more than the first bounce
The wick near $1,730 is the clearest downside reference from the latest move. A return to that level would show how much demand remains after the initial bounce. If an hourly candle closes below the area and the next rebound stalls beneath it, sellers would have extended the November 18 decline.
The two immediate signals are easy to follow on the hourly chart. A close above $1,770 followed by a higher low would give buyers a foothold for another move toward $1,800. A new hourly low below the November 18 trough would put the focus back on the wider decline.
Related: Ethereum Price Analysis as ETH Battles to Recover $1,800