
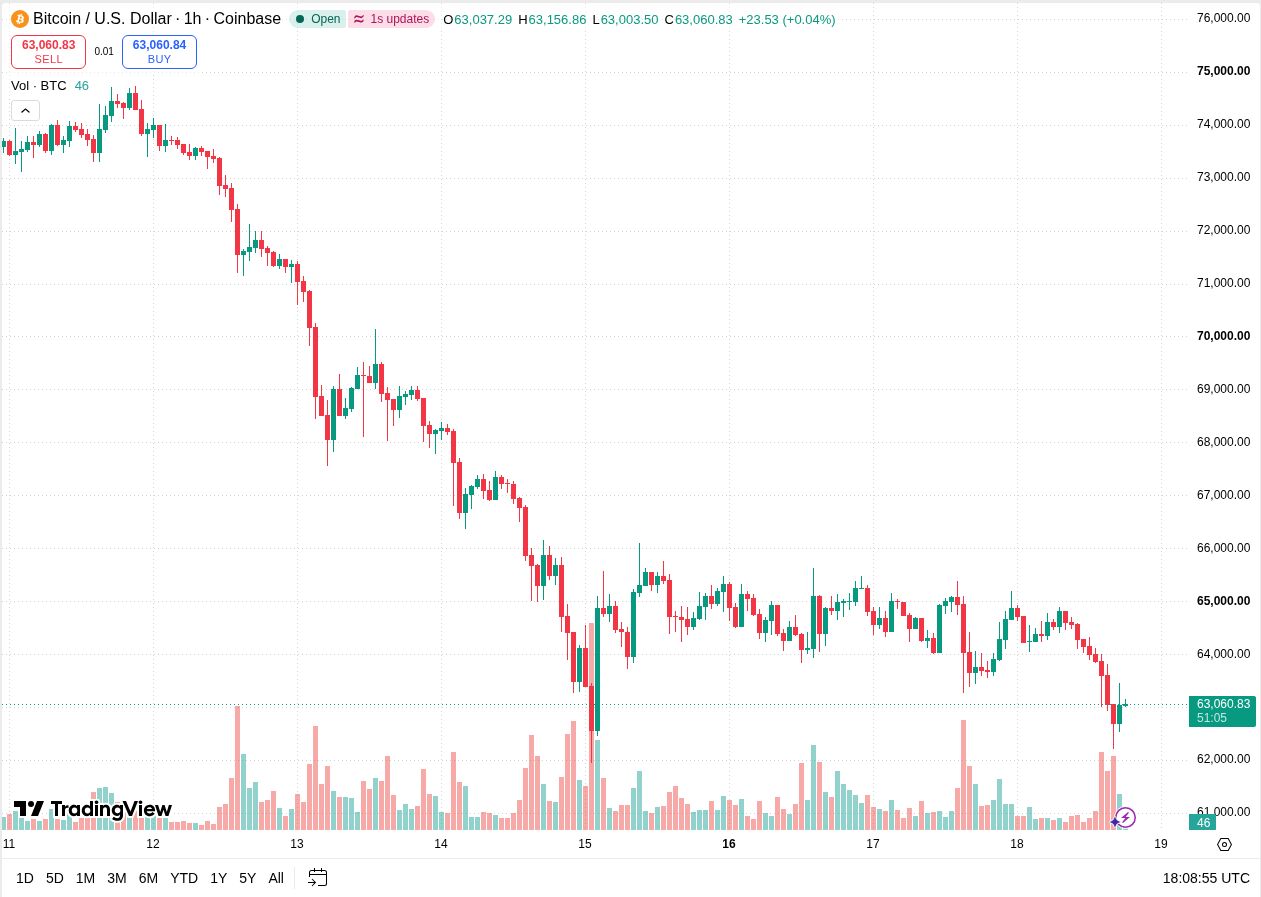
Bitcoin rebounded from around $62,200 on November 18 and was trading at $63,060.83 around 18:09 UTC. The bounce brought BTC back above $63,000, but it remained below $64,000 after a series of lower hourly highs.
The TradingView’s 1-hour BTC/USD chart showed the 18:00 UTC candle open at $63,037.29 and trade between $63,003.50 and $63,156.86 by the time of the snapshot. At that point, the candle was still open, with Bitcoin only modestly above where the hour began.
Bitcoin price analysis puts $63,050 in focus
Several of the larger volume bars near the right edge of the chart came during the decline. The green candle that followed shows buyers responding near the low. Around $63,050, the first test was whether the rebound could turn into a stretch of hourly trading above $63,000.
Why $64,000 matters for the recovery
The chart shows an earlier stretch of trading around $64,000 before the move toward $62,200. That makes $64,000 a useful checkpoint. A move back above it would put Bitcoin inside the area it traded in before the latest drop.
Closer to the current range, the open hour had reached $63,156.86. A completed candle above roughly $63,150, followed by a pullback that stays above $63,000, would show the rebound gaining ground. The chart still shows earlier rallies topping out in the mid-$64,000s.
What would put $62,200 back under pressure?
If the bounce gives way below $63,000, the November 18 low near $62,200 comes back into focus. A short dip followed by a close back above that area would suggest buyers are still active there. An hourly close below it would extend the decline seen in the snapshot.
The wider chart also shows a prior trough around $62,000. That zone sits close to the November 18 low, so the two levels are best read together. Above $63,000, the first signs of recovery would come from higher hourly lows and a move back toward $64,000.
Related: Bitcoin Price Analysis as BTC Struggles to Hold $64,000