
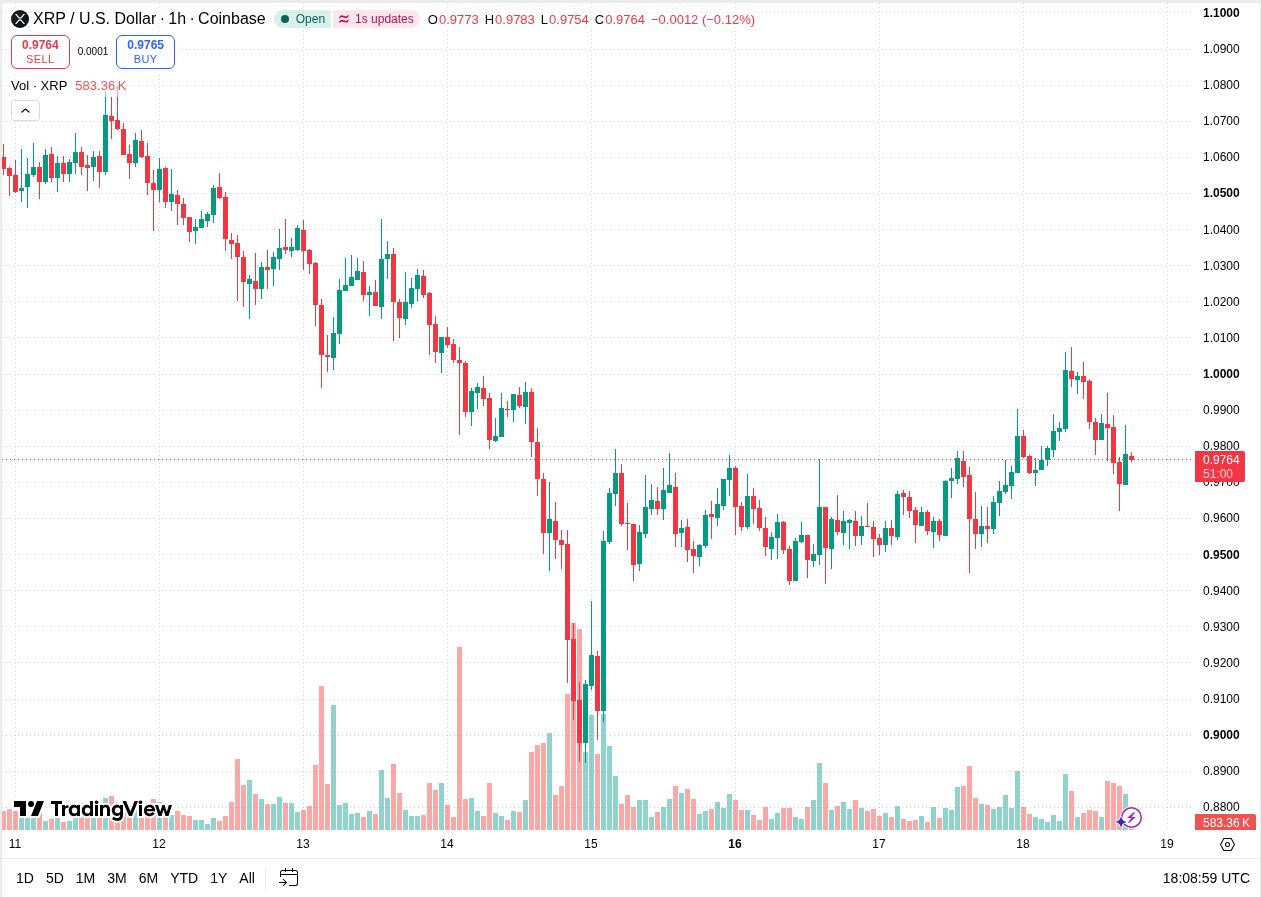
XRP briefly traded above $1 on November 18 before sliding toward $0.96. It had recovered to $0.9764 around 18:09 UTC, leaving the price just below $0.98 after its earlier attempt to hold above a dollar faded.
The TradingView’s 1-hour XRP/USD chart showed the 18:00 UTC candle open at $0.9773. By the time of the snapshot, it had traded between $0.9754 and $0.9783. The candle was still open, with XRP below the opening price for the hour.
XRP price analysis tracks the $0.98 recovery test
The chart shows several red candles after XRP crossed $1, followed by a green candle off the latest low. That bounce narrowed the loss, but the price had yet to reach $0.98 again. The open hour’s high of $0.9783 offers a nearby level to track before the round number comes back into play.
Where the rebound could hit resistance
A close above $0.98 would shift attention to the area around $0.99, where XRP had traded before and during the reversal. Holding above $0.98 on the next dip would give the recovery a stronger base. A return below the area soon after a break would keep the bounce on weaker footing.
The $1 threshold matters because XRP crossed it earlier in the session and then gave back the move. A later hourly close above $1, followed by a pullback that holds near the level, would give buyers a clearer sign of progress. The earlier chart peak just above $1 remains the next visible hurdle.
What would put the $0.96 area at risk?
If the recovery stalls, the recent low around $0.96 remains the first support area. The chart shows earlier November 16 and 17 trading in the mid-$0.94s to around $0.95. A sustained break below the November 18 low would bring that earlier zone back into view.
The next useful signal is where XRP finds buyers on a pullback. A higher low above the November 18 trough and a close through $0.98 would put $0.99 and $1 back in focus. Another failed move toward $0.98 would leave the $0.96 area exposed to a new test.