
Bitcoin traded at $63,673.08 on November 19 after climbing back from the low $62,000s. The advance slowed just below $64,000, where several hourly candles failed to extend the bounce. The first test for buyers is whether they can close an hour above that level and hold it on the next pullback.
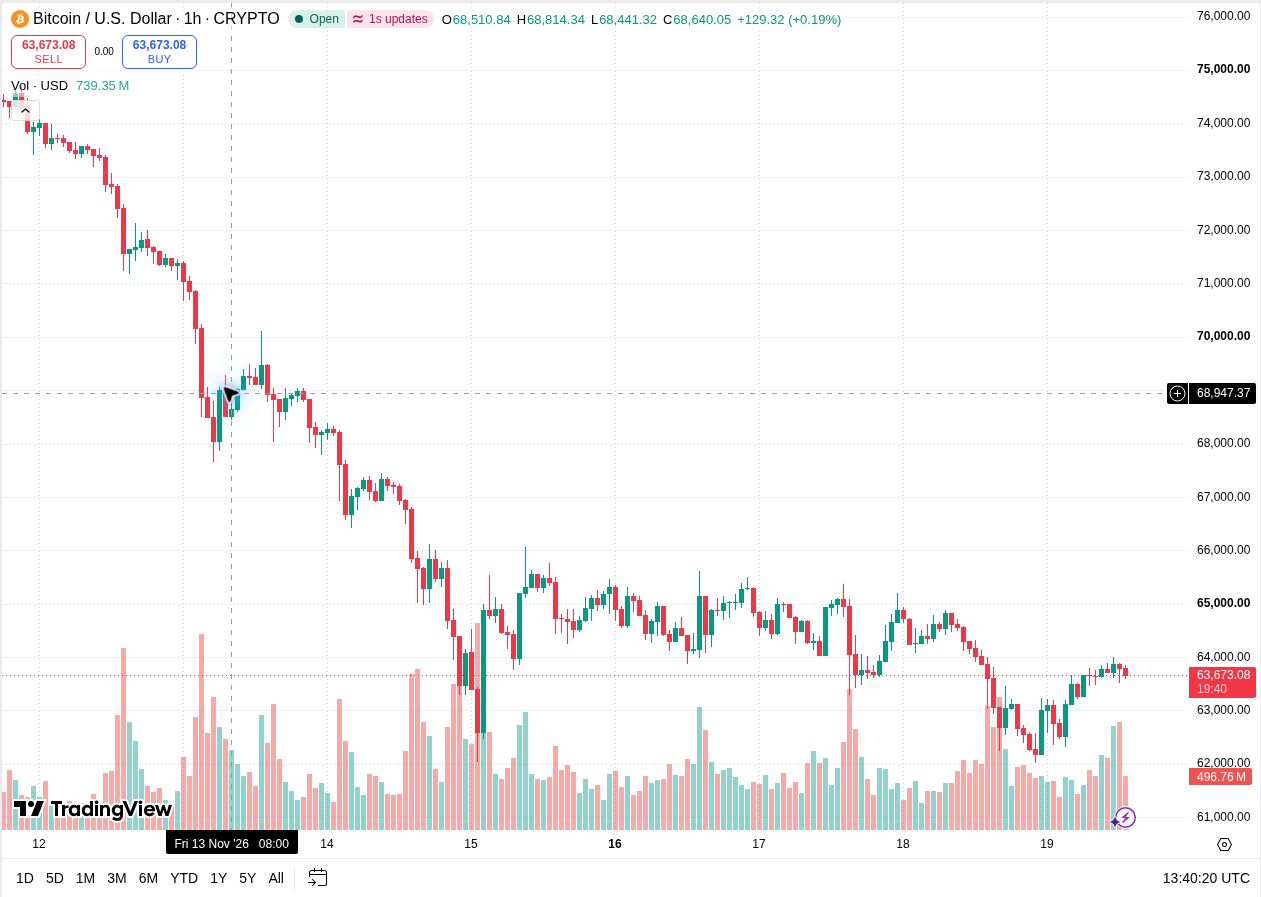
TradingView’s BTC/USD hourly chart shows Bitcoin recovering into the upper $63,000s after the November 18 selloff. The latest candles are much smaller than the rebound candles that carried price away from the low. That compression puts the recent highs and the base of the bounce in focus.
Bitcoin price analysis puts $64,000 in focus
The right side of the chart shows a climb from the low $62,000s, followed by a cluster of candles beneath $64,000. Several nearby candles tested the same area. Repeated attempts make the zone more useful than a single isolated print, though the recent candles still sit inside the larger range that formed after the November 15 decline.
Bitcoin support and resistance levels
Around $63,500 is the nearest area to watch on a dip. It sits just beneath the cluster that formed after the initial rebound. Below it, $63,000 is the next reference because several candles traded around that level before the market moved into the upper $63,000s. The low $62,000s remain the deeper area from which the rebound started.
A close above $64,000 would bring the earlier November 18 trading area near $64,700 to $65,000 into focus. The chart shows several candles in that band before the selloff. Buyers would have a clearer case for a sustained move if a later pullback stays near or above $64,000.
At the snapshot price, Bitcoin was about $327 below $64,000 and about $173 above $63,500. Those nearby levels bracket the recent pause. A wick above $64,000 that closes back below would leave that range intact. If it closes above, the next dip can show whether bids now appear where the earlier rally stalled.
The volume bars add context to that test. Compare a completed breakout candle with the completed candles in the pause. A stronger bar would show that more trading accompanied the move. If price clears the level on a quiet candle, the pullback is especially useful for judging whether the move can hold.
What would confirm the next BTC move?
- An hourly close above $64,000, then a pullback that holds near that level, would show that a former ceiling is starting to attract bids.
- A move below about $63,500 followed by a failed bounce would expose $63,000 again. A sustained break there would bring the low $62,000s back into view.
Bitcoin can make progress on the hourly chart while the broader structure is still weak. The visible decline started well above the current range. Until buyers reclaim the prior trading area near $65,000, the November 19 move is best read as a rebound within that wider decline. The next hourly close around $64,000 will tell readers more than a brief move through it.
Read the November 18 Bitcoin price analysis for the previous session’s levels.