
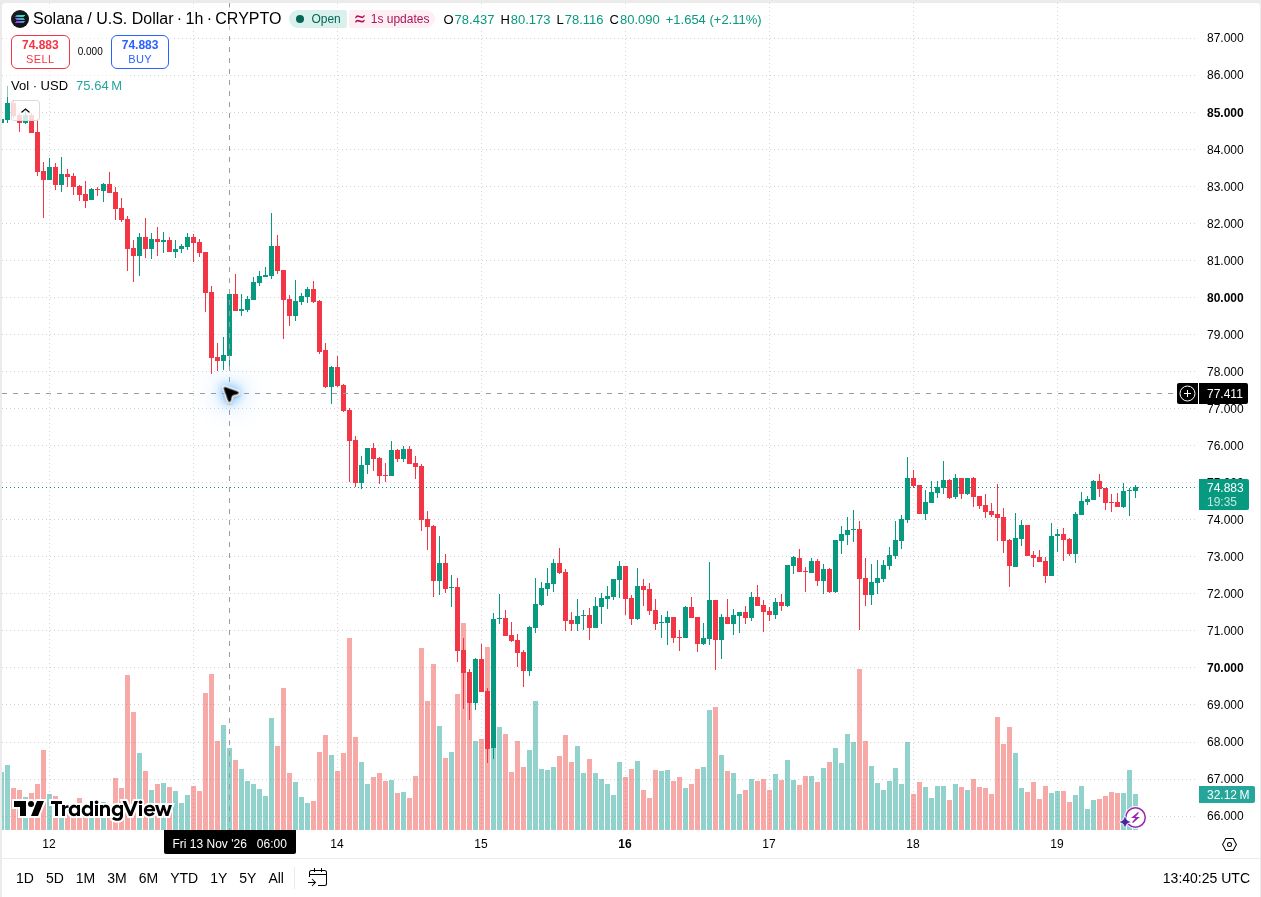
Solana traded at $74.883 on November 19 after recovering from the low $73 area. SOL was back near $75 after giving up that area in the previous session. The hourly chart places the next upside test near $75.50 to $76, where the prior rally met selling.
TradingView’s SOL/USD hourly chart shows a recovery from the latest dip into a group of tightly spaced candles just below and around $75. The latest price sits inside that cluster. An earlier wick above $75 shows why the reaction on a later pullback matters more than the first touch of the round number.
Solana price analysis watches the range near $75
Solana’s advance cleared the area where price had paused around $74. The latest candles now overlap at higher prices, with several lower wicks dropping toward the mid-$74s. That puts roughly $74.30 to $74.60 on the short-term map. If bids appear there again, readers can watch for a new attempt at the recent high.
Solana support and resistance levels
The area around $75 to $75.50 is the immediate barrier. Several candles on November 18 turned in that part of the chart, with wicks reaching toward $76. An hourly close beyond the upper part of that zone and a later hold above $75 would show that buyers have cleared more of the prior range.
If the mid-$74 area breaks, the round $74 level is the next reference. Below that, the chart shows a cluster around $73 that preceded the latest leg higher. A sustained drop through that cluster would put the previous lows in the low $72s back in view.
At the capture price, SOL was about $0.12 below $75 and about $0.62 below $75.50. The first gap is narrow enough for a single wick to cross it. The second takes price closer to the top of the recent range. Readers can judge the breakout by whether the candle closes through that upper area and whether the next pullback stays near $75.
Inside the range, the sequence of lows matters. If each dip bottoms above the last one while $75 keeps capping the highs, buyers are giving up less ground on each pullback. A dip that breaks the mid-$74s and then fails to recover would interrupt that pattern.
What would confirm the next SOL move?
- A close through about $75.50, followed by a dip that stays near or above $75, would support a move toward $76.
- An hourly close below $74, followed by a weak attempt to reclaim it, would bring the $73 area back into focus.
On the broader chart, the bounce comes after a decline from the mid-$80s and a volatile stretch near $70. That history makes the $75 area more informative than the day’s price alone. If SOL can keep making higher lows around the mid-$74s, the recent advance has room to develop. A return below $74 would put the focus back on the range that produced it.
Read the November 18 Solana price analysis for the previous session’s levels.