
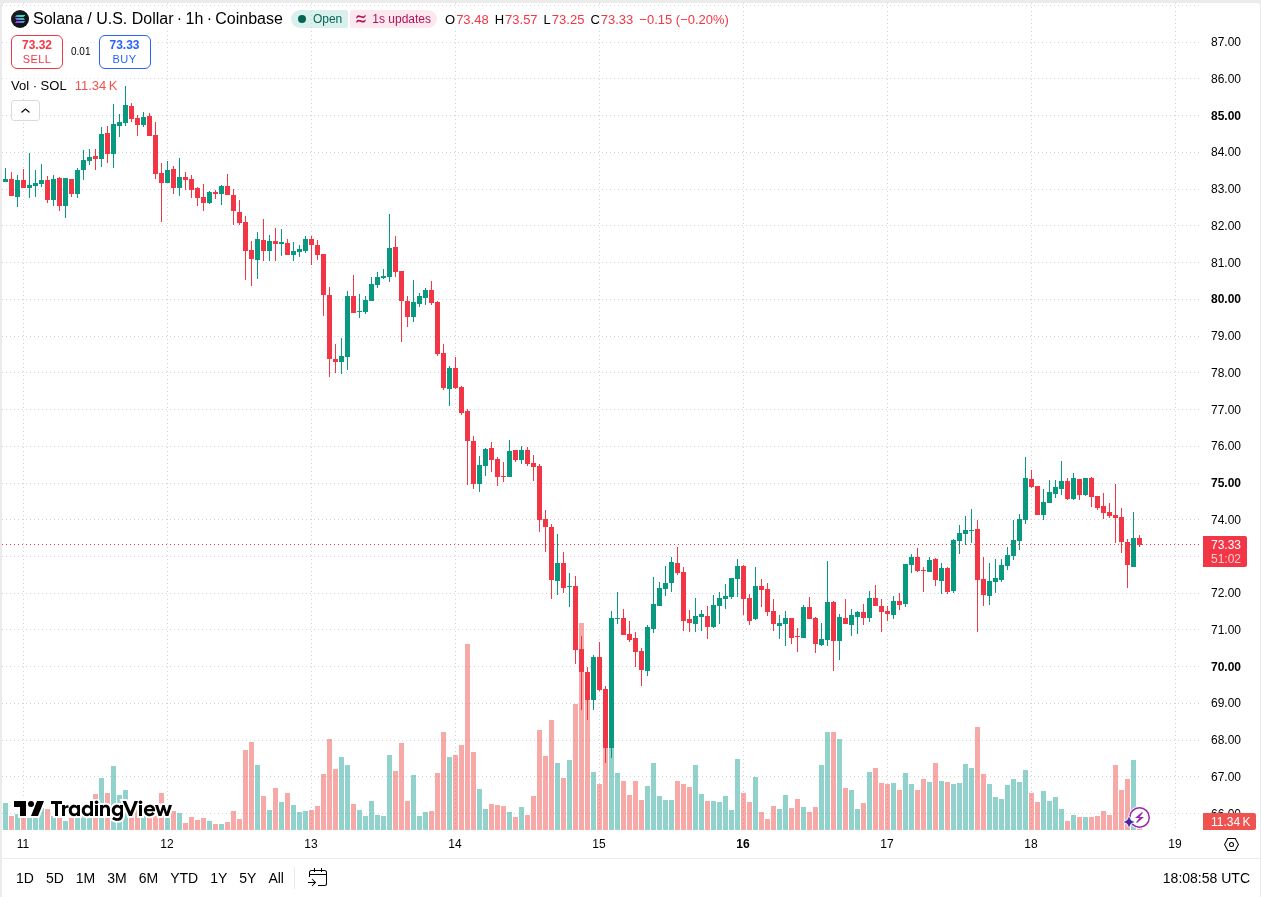
Solana rebounded from just above $72 on November 18 and was trading at $73.33 around 18:09 UTC. The bounce erased part of the fall from above $75, while $74 remained the first major level SOL had lost on the way down.
The TradingView’s 1-hour SOL/USD chart showed the 18:00 UTC candle open at $73.48 and trade between $73.25 and $73.57 by the time of the snapshot. At $73.33, Solana was below the opening price of the still-open candle, even after climbing from the earlier low.
Solana price analysis watches the return toward $74
The recent rebound candle appears beside a relatively tall green volume bar. That shows trading picked up during the move away from the low. The next candle was smaller at the time of the snapshot, with SOL still trading within a narrow range below $74.
Why $73.40 and $74 both matter
The first band to watch is around $73.40 to $73.60. It spans the opening price and the high seen in the open candle at the time of the snapshot. An hourly close through that band would give buyers a clearer shot at $74, particularly if a later dip holds above it.
The chart shows earlier November 18 trading above $74 and highs around $75 to $75.60. That gives the rebound two tests. The first is getting back above $74. The second is holding that area long enough to put pressure on the earlier highs, where the latest decline began.
What would expose the lower range?
The recent low just above $72 is the first area to watch if the rebound fades. The wider chart shows another earlier dip around $71. If SOL closes below the November 18 low and fails to reclaim it, that lower area would become the next visible reference.
Solana’s November 18 bounce recovered part of the latest move down while leaving the earlier breakdown intact. A move through $73.60 followed by a hold above $74 would make the rebound more durable. A drop back toward $72 would put the focus on whether buyers can defend the same area again.
Related: Solana Price Analysis as SOL Tests Resistance Near $72.60